Google Classroom
GeoGebra
GeoGebraKlasse
Log ind
Søg
Google Classroom
GeoGebra
GeoGebraKlasse
Opsummering
Statistics
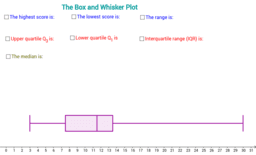
Box Plot
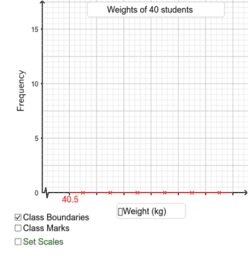
Drawing Histograms
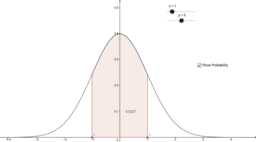
Altering the standard deviation and mean of the normal curve
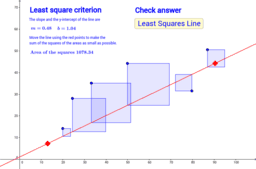
Least Squares Criterion
Statistics
Forfatter
Dr. Edgar
Box Plot
Drawing Histograms
Altering the standard deviation and mean of the normal curve
Least Squares Criterion
Næste
Box Plot
Nye Materialer
Shadow of a Cube
Average Rate of Change: Graph a Function (1)
Variation Theory Parallelogram Proofs
Quiz: Finding Average Rate of Change
Dodecahedron
Opdag Ressourcer
Shawver 2, Shermir Hill
PantulanTranslasi
demo
Il grafico della funzione seno
spongebob 2
Udforsk emner
Omskreven cirkel
Rotation
Lineære funktioner
Tal
Logaritme