Google Classroom
GeoGebra
GeoGebra Classroom
ورود به سایت
جستجو
Google Classroom
GeoGebra
GeoGebra Classroom
Outline
Estatística
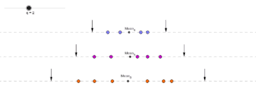
Statistical Outliers Impossible in Small Samples
Outlier Influence
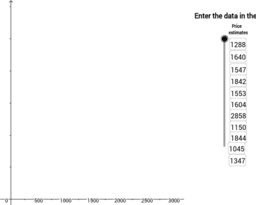
Estimate using Box Plot
Outliers
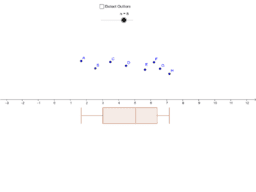
Dynamic Boxplot
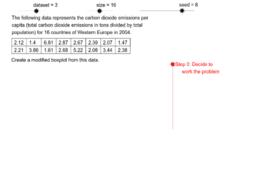
Step Through Modified Boxplot Construction
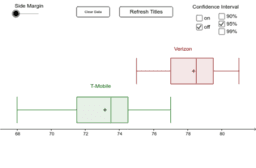
Generate Two Boxplots
Boxplot Game
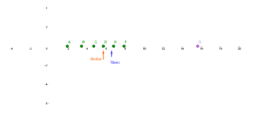
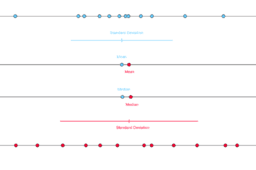
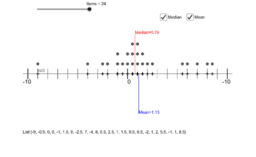
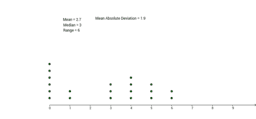
Mean, Median, and Standard Deviation
Dot Plot Interactive
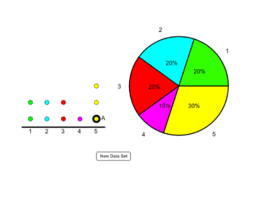
AQR Section 16: Creating a Pie Chart From a Dot Plot
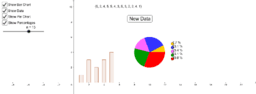
Bar Charts and Pie Charts
Dot Plot Tool
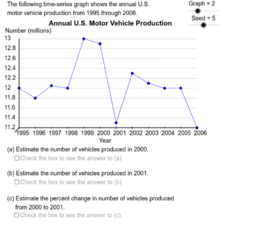
Time Series Analysis Problems
Least Squares Demonstration
Estatística
:نویسنده
Palmerim
Statistical Outliers Impossible in Small Samples
Outlier Influence
Estimate using Box Plot
Outliers
Dynamic Boxplot
Step Through Modified Boxplot Construction
Generate Two Boxplots
Boxplot Game
Mean, Median, and Standard Deviation
Dot Plot Interactive
AQR Section 16: Creating a Pie Chart From a Dot Plot
Bar Charts and Pie Charts
Dot Plot Tool
Time Series Analysis Problems
Least Squares Demonstration
بعدی
Statistical Outliers Impossible in Small Samples
منابع آموزشی جدید
Identificando Números Primos e Compostos
Classificando Triângulos em um Geoplano(malha Quadrada)
Tarefa para explorar a demonstração do critério de divisibilidade por 9
Fabricação Digital (livro em PDF)
Gráficos e equações da Função Afim
کشف منابع آموزشی
ex 3
la pente de la ligne droite
NC- F32- Maria Carolina- 9B
NC-Ficha 34-Alex Zlatkovic- 9B
volume
کشف موضوعها
تقارن
نمودار تابع
حساب دیفرانسیل و انتگرال
دوران
توابع مثلثاتی