Google Classroom
GeoGebra
GeoGebra Classroom
Sign in
Search
Google Classroom
GeoGebra
GeoGebra Classroom
Outline
Handling Data
Probability
Graphs
Averages
Handling Data
Author:
HHAMaths
Table of Contents
Probability
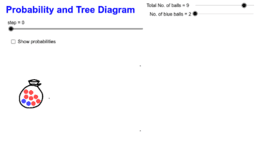
Probability and Tree Diagram
Conditional Probabilities and Independence
Experimental Probability Spinner
Copie de Probability and Tree Diagram
Graphs
Distance Time Graphs
Bar Charts and Pie Charts
Cumulative Frequency Properties
Scatter Graph
Averages
Box-and-Whisker Plot Generator
Mean Median
Next
Probability and Tree Diagram
New Resources
Blancmange curve (fractal)
alg2_05_05_04_applet_exp_fxn_flvs
Explore the invariant lines of matrix {{-2,5},{6,-9}}
Poorly Drawn Parallelograms
Average Rate of Change: Graph a Function (1)
Discover Resources
Level 5 Portfolio-IanKieme
kite guglielmo meriggi
Midpoints and P
Special Triangle Exploration
Modul 3.2_Ade Erni_SMPN 2 Teluk Gelam
Discover Topics
Planes
Ratios
Cuboid
Pie Chart or Circle Chart
Limits