Google Classroom
GeoGebra
GeoGebra Classroom
Sign in
Search
Google Classroom
GeoGebra
GeoGebra Classroom
Outline
Algebra 1
Statistics
Solving Linear Functions and Inequalities
Graphing Linear Functions
Writing Linear Functions
Algebra 1
Author:
N.Andringa
,
Thomas Gebbie
Topic:
Algebra
Table of Contents
Statistics
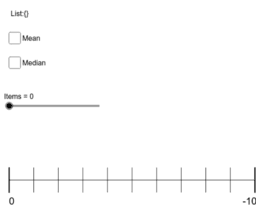
Dot Plot Generator
Box and Whisker Practice #2
Compare Box and Whisker Plots
Solving Linear Functions and Inequalities
Algebraic Proof Justification 1
Algebraic Proof Justification 2
Literal Equations Proof Justification
Graphing Linear Functions
Investigate the relationship between the three forms of line
First, use the sliders to create the parent function, y = x.
DIGI203-3D #8
Writing Linear Functions
Point Slope Form Matching
Slope Intercept Form Matching
Equivalent Linear Equations Matching
Next
Dot Plot Generator
New Resources
Icosahedron1
Poorly Drawn Parallelograms
Dodecahedron
Average Rate of Change: Graph a Function (2)
Poorly Drawn Parallelograms 2
Discover Resources
Parkettierung06
Unit 2 Practice
Logo Turtle
Punti e vettori nello spazio
Question b
Discover Topics
Curve Sketching
Tangent Line or Tangent
Coordinates
Random Variables
Secant Line or Secant