Google Classroom
GeoGebra
GeoGebra Classroom
Sign in
Search
Google Classroom
GeoGebra
GeoGebra Classroom
Outline
Contour Plots
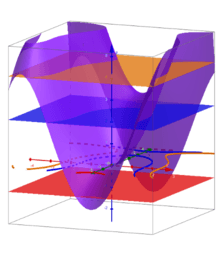
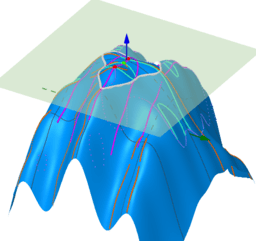
Contour plot and surface
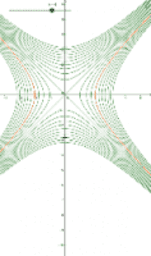
Function of several variables: several level curves
sin(x*y)+sin(x^2+y^2)- Images to Visualizing Functions of Two Variables
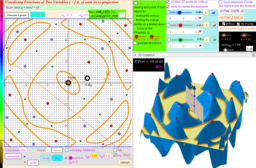
Visualizing Functions of Two Variables. Version 3
Contour Plots
Author:
Edward Wicks
Contour plot and surface
Function of several variables: several level curves
sin(x*y)+sin(x^2+y^2)- Images to Visualizing Functions of Two Variables
Visualizing Functions of Two Variables. Version 3
Next
Contour plot and surface
New Resources
bearing HK
Polar Reciprocation
Divisible Polynomials - Remainder and Factor Theorems
Chaotic behaviour
Flag in the wind
Discover Resources
Percentage Increase/Decrease Bar Model
Obtinere cilindru infasurare
ABC Triangle
SorinSapojnic3
ЕГЭ-профиль 12-1-ТЕСТ-5 примеров
Discover Topics
Binomial Distribution
Integral Calculus
Cosine
Incircle or Inscribed Circle
Definite Integral