Google Classroom
GeoGebra
GeoGebra Classroom
Sign in
Search
Google Classroom
GeoGebra
GeoGebra Classroom
Outline
Demo
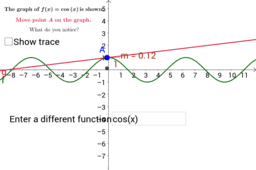
Visualize the graph of the derivative of a given function
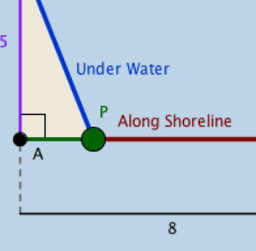
Oil Pipeline Optimization Problem
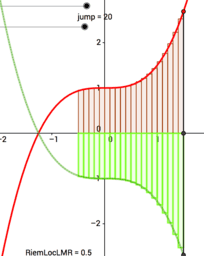
C0702 Volume Disk Method 3D Visual
Demo
Author:
Miriam Ramirez
Visualize the graph of the derivative of a given function
Oil Pipeline Optimization Problem
C0702 Volume Disk Method 3D Visual
Next
Visualize the graph of the derivative of a given function
New Resources
Explore the invariant lines of matrix {{-2,5},{6,-9}}
Finding Average Rate of Change of a Function
Flip Flop
Blancmange curve (fractal)
Droste effect
Discover Resources
Solve by Graphing
Animation 80
sys7
Fraction
Circumcenter
Discover Topics
Symmetry
Planes
Rectangle
Median Value
Boxplot