Google Classroom
GeoGebra
GeoGebra Classroom
Sign in
Search
Google Classroom
GeoGebra
GeoGebra Classroom
Outline
Statistics & Probability
Descriptive Statistics
Bivariate Statistics & Modeling
Sets
Probability Distributions
Statistics & Probability
Author:
Ben Roth
Topic:
Probability
,
Statistics
Table of Contents
Descriptive Statistics
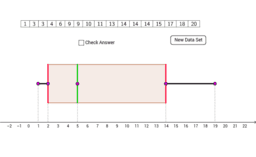
Creating a Box and Whisker Plot
Creating Box Plots
Data Analyzer - One Variable
Where's the Mean?
Histogram and Box & Whisker Plot
Cumulative Frequency Properties
Cumulative Frequency Graph
Cumulative Frequency Polygon
Interpretation of Cumulative Frequency Polygon
Interactive box plot
Bivariate Statistics & Modeling
Dynamic Correlation
Line of Best Fit with Least Squares
Data Analyzer - Two Variables
Sets
Real Number System Sorter
Venn Diagram (2 Sets)
Venn Diagram (3 Sets)
Probability Distributions
Flipping a Coin
Guess the game!
Flipping 1 coin
Rolling two dice
Rolling a dice
Flipping 2 coins
Rolling Two Dice
Rolling a Die
Rolling 8-Sided Dice
Rolling Three Dice
Next
Creating a Box and Whisker Plot
New Resources
Exploring the Derivative of an Exponential Function
Roman Numerals Bingo
Shade a spheric triangle with "surface".
Taylor Polynomial
alg2_05_05_01_applet_exp_2_flvs
Discover Resources
temp
Pythagorean Theorem
Activity4
Adição de Vetores
Pythagorejský ornament
Discover Topics
Real Numbers
Sine
Constructions
Set Theory
Logarithmic Functions