Google Classroom
GeoGebra
GeoGebra Classroom
Sign in
Search
Google Classroom
GeoGebra
GeoGebra Classroom
Outline
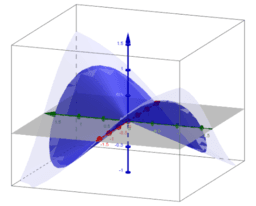
Visualization of limits of functions of two variables
Introduction
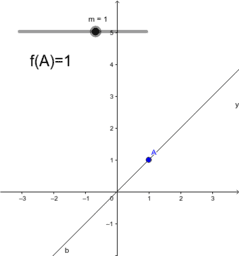
Example 1
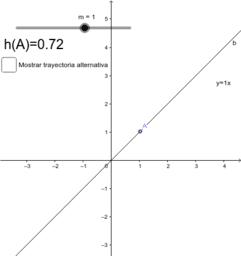
Example 2
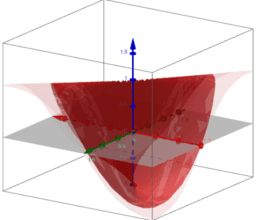
Example 3
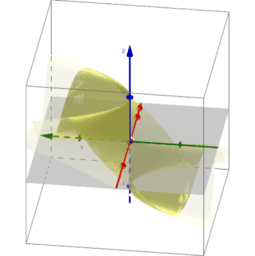
Polar coordinates: Example 1
Polar coordinates: Example 2
Polar coordinates: Example 3
Thank you very much
Visualization of limits of functions of two variables
Author:
Laura del Río
Topic:
Functions
,
Limits
Presentation for sharing at the GeoGebra Global Gathering 2017
Introduction
Example 1
Example 2
Example 3
Polar coordinates: Example 1
Polar coordinates: Example 2
Polar coordinates: Example 3
Thank you very much
Next
Introduction
New Resources
Lorenz Attractor: Multiple particles
Art and Rotational Symmetry
Road Runner (beep, beep)
Graphing Logarithmic Functions
Roman Numerals Bingo
Discover Resources
ARCTG+ARCCTG=0.5*PI
Plotting Points
Shawver Period 2, Caprice Frazier
Translation animation- Malik Shahin
A.2.6.2 Much Ado about Ages
Discover Topics
Random Variables
Power Functions
Linear Regression
Prism
Hyperbola