Google Classroom
GeoGebra
GeoGebra Classroom
Sign in
Search
Google Classroom
GeoGebra
GeoGebra Classroom
Outline
Statistics
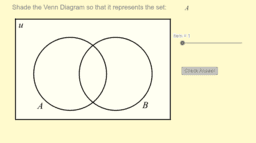
Sets and Venn Diagrams (2 Sets)
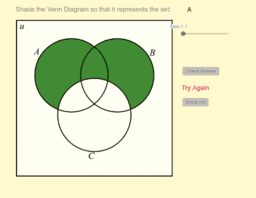
Venn Diagram (3 Sets)
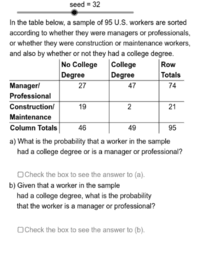
Computing Probabilities from Tables
Statistics
Author:
Kevin Moore
Sets and Venn Diagrams (2 Sets)
Venn Diagram (3 Sets)
Computing Probabilities from Tables
Next
Sets and Venn Diagrams (2 Sets)
New Resources
alg2_05_05_01_applet_exp_flvs
Explore the invariant lines of matrix {{-2,5},{6,-9}}
Average Rate of Change: Graph a Function (1)
Flip Flop
Chaotic behaviour
Discover Resources
Sum of interior angles of polygons
Blank Rigid Motions Example Good
Lucky's Land
Projet Math
Vinkeltyper
Discover Topics
LCM and GCD
Fractions
Trigonometry
Standard Deviation
General Quadrilateral