Google Classroom
GeoGebra
GeoGebra Classroom
Sign in
Search
Google Classroom
GeoGebra
GeoGebra Classroom
Outline
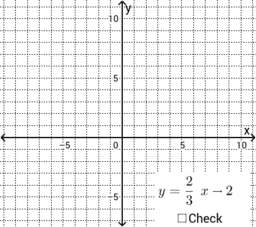
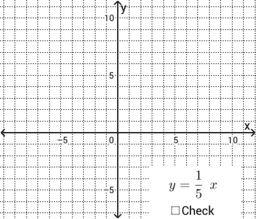
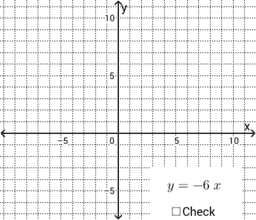
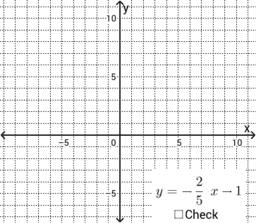
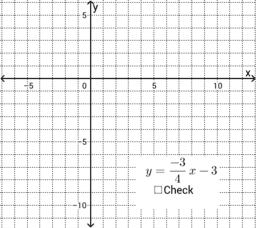
Graphing Lines with y=mx+b
a
b
c
d
e
f
g
h
Make Your Own Graph
Graphing Lines with y=mx+b
Author:
Brett Bellaire
a
b
c
d
e
f
g
h
Make Your Own Graph
Next
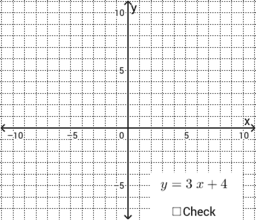
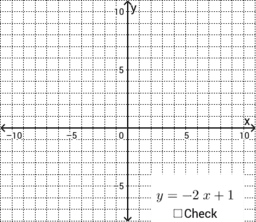
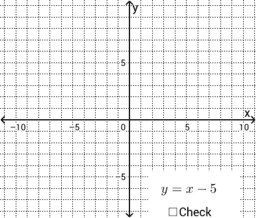
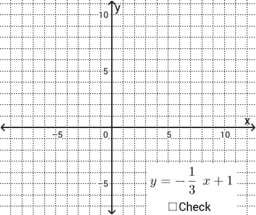
a
New Resources
Dodecahedron
Average Rate of Change: Graph a Function (2)
Tutorial: Create lists of numbers and objects
Average Rate of Change: Graph a Function (1)
Exploring the Derivative of a Quadratic Function
Discover Resources
Geogebra forum
actvt_1
Types of angles Exercises
Demo: Counting the number of turns
Apollonius circles in the CCP case
Discover Topics
Circle
Poisson Distribution
Pie Chart or Circle Chart
Statistical Characteristics
Cube