"No Slope, or Gentle Slope"?
Drills
What do you notice? What do you wonder?
Teacher Workshop Activity
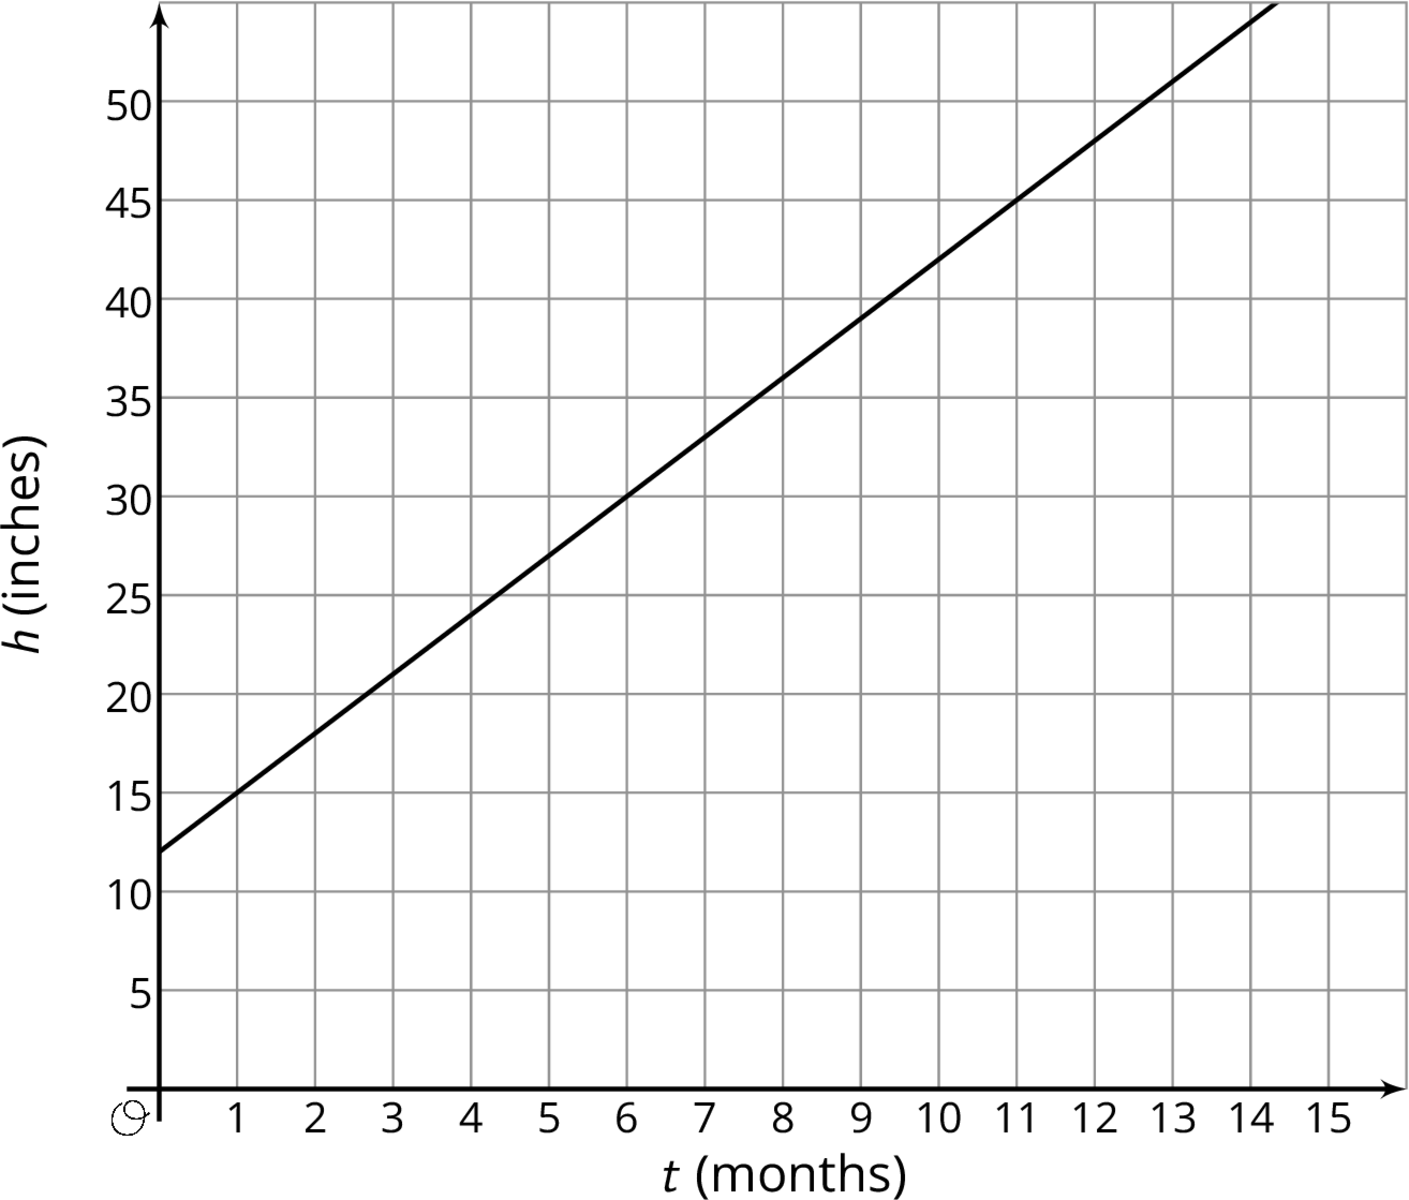 After brief quiet think time, select 1–2 students to share their ideas. (For example, something starts at 12 inches and grows 15 inches for every 5 months that pass.)Remind students that axes labels help us determine what quantities are represented and should always be included. Let them know that in this activity the graphs of three functions have been started, but the labels are missing and part of their work is to figure out what those labels are meant to be.Give students 3–5 minutes of quiet work time and then time to share responses with their partner. Encourage students to compare their explanations for the last three problems and resolve any differences. Follow with a whole-class discussion.
Raduis, and Circumference Standards
The graphs of three functions are shown.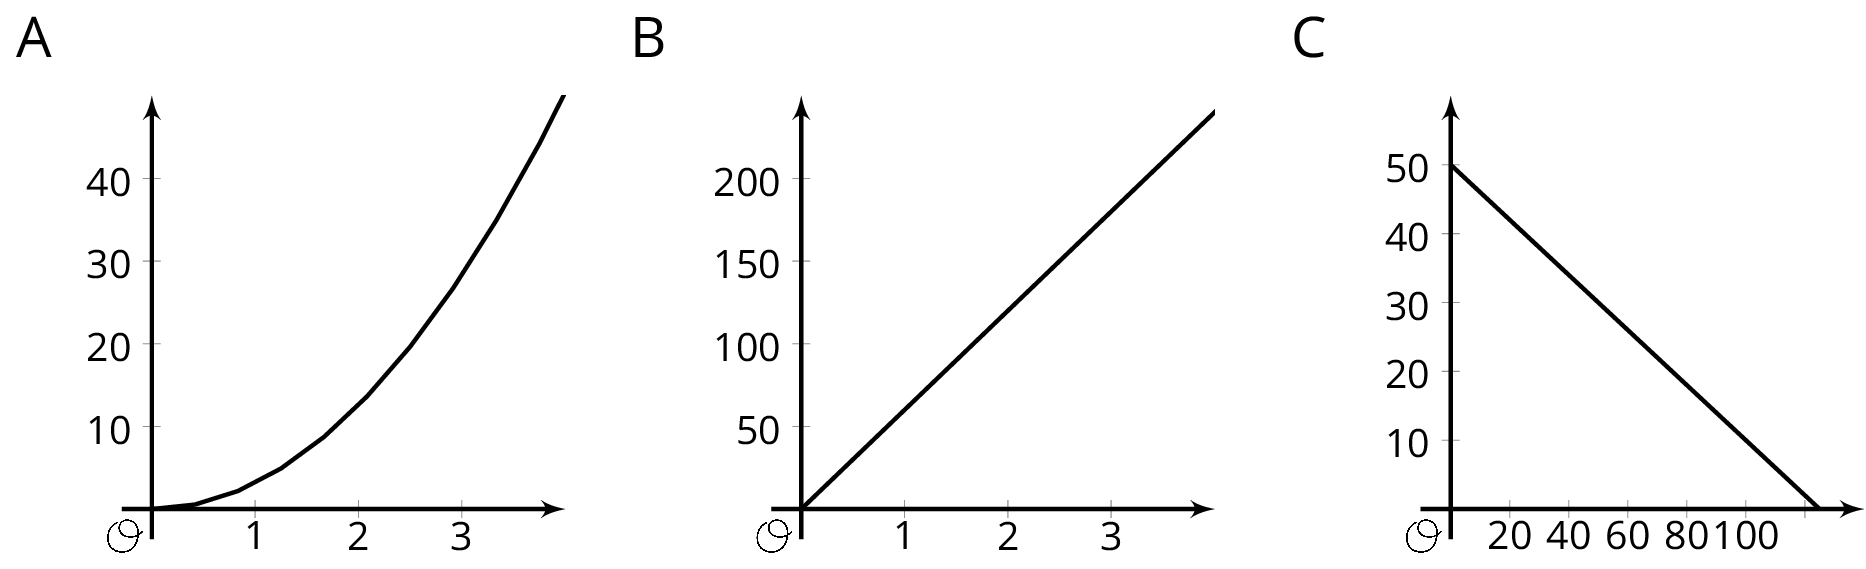
Dude, are you ready for MORE?
"Are you ready for more?"A function inputs fractions ab between 0 and 1 where a and b have no common factors, and outputs the fraction 1b. For example, given the input 34the function outputs 14, and to the input 12 the function outputs 12. These two input-output pairs are shown on the graph.Plot at least 10 more points on the graph of this function. Are most points on the graph above or below a height of 0.3? Of height 0.01?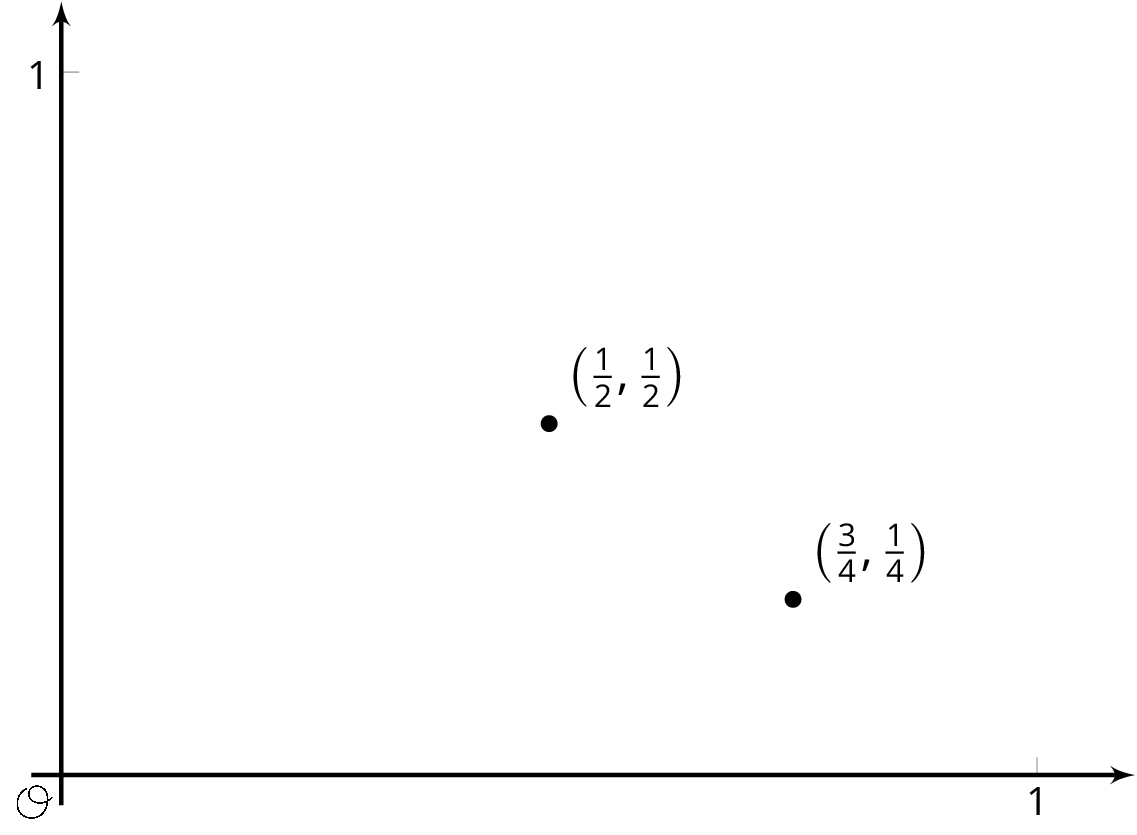
Homework/Exit Ticket
 dt
dt