IM3.7.6 Shape
- Author:
- Lind, Jon
The importance of shape
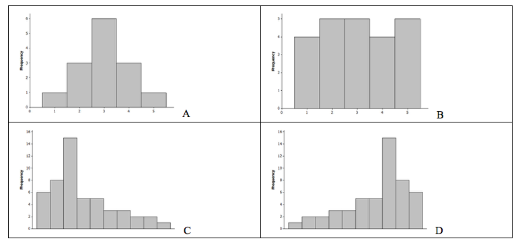
Data with the same measures of center and spread can have very different shapes, and those shapes affect how we interpret the data. Choose from the following to describe the four histograms. 1. Skewed to the left 2. relatively uniform 3. skewed to the right 4. symmetric How can these shapes help inform your interpretation of the data?
A "Normal" distribution
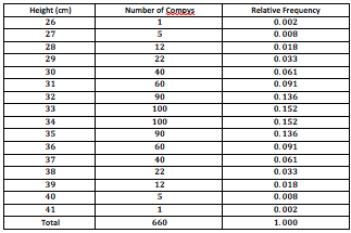
The following is a relative frequency histogram of the compy heights. To model this data with a smooth (-ish) curve, construct points at the top middle of each bar, and connect your points with a polyline .
.
.Finding statistics on your calculator
On your calculator, press STAT --> Edit, then enter the heights in L1 and frequencies (number of compys) in L2. Press STAT --> Calc --> 1-Var Stats. Make sure L1 is "List" and L2 is "FreqList", then Calculate. What is the mean and standard deviation of the heights of these dinosaurs? Draw vertical lines through the mean and 1 and 2 standard deviations from the mean on the histogram above.