Google Classroom
GeoGebra
GeoGebra Classroom
Sign in
Search
Google Classroom
GeoGebra
GeoGebra Classroom
Outline
Mathematics of finance
Portfolios with one risky investments
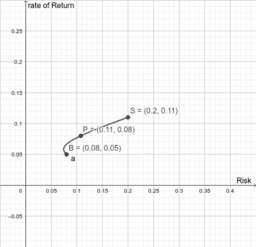
Portfolios with two risky investments
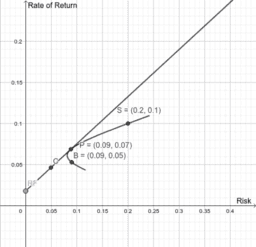
Two Risky and One Risk Free Investment
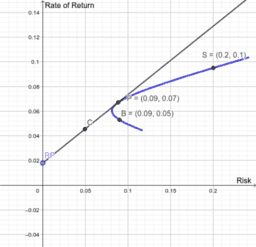
Two Risky and One Risk Free Investment Zoomed
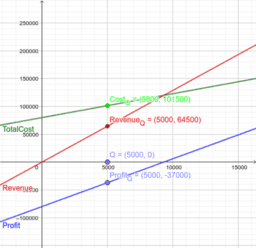
Break Even analysis
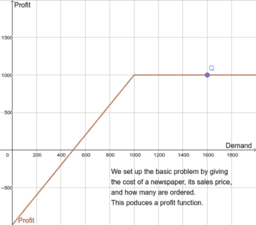
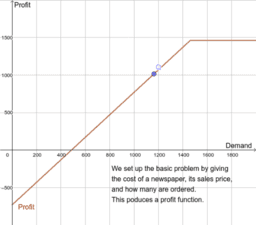
Newsvendor Problem- Normal Distribution
Newsvender Problem, Uniform Distribution
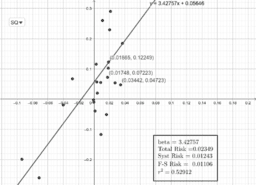
Security Characteristic Lines
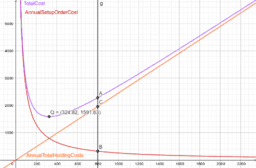
Economic Ordering Quantity
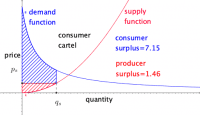
Consumer Cartel
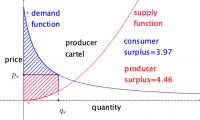
Producer Cartel
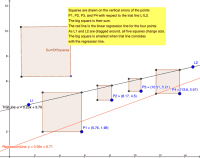
Linear Regression Example
Mathematics of finance
Author:
Mike May
Topic:
Mathematics
A book of applets for visualizing finance.
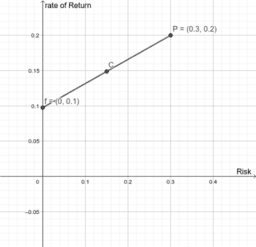
Portfolios with one risky investments
Portfolios with two risky investments
Two Risky and One Risk Free Investment
Two Risky and One Risk Free Investment Zoomed
Break Even analysis
Newsvendor Problem- Normal Distribution
Newsvender Problem, Uniform Distribution
Security Characteristic Lines
Economic Ordering Quantity
Consumer Cartel
Producer Cartel
Linear Regression Example
Next
Portfolios with one risky investments
New Resources
Finding Average Rate of Change of a Function
Poorly Drawn Parallelograms 2
Poorly Drawn Parallelograms 3
Average Rate of Change: Graph a Function (2)
Blancmange curve (fractal)
Discover Resources
Theorem 1-3
Watson Geogebra Project
Formula for finding centre of angle difference complex Loci
เรือน้อย
Dodecahedron
Discover Topics
Complex Numbers
Coordinates
Confidence Interval
Intersection
Linear Programming or Linear Optimization