Google Classroom
GeoGebra
GeoGebra Classroom
Sign in
Search
Google Classroom
GeoGebra
GeoGebra Classroom
Outline
statistics
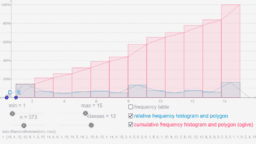
histograms
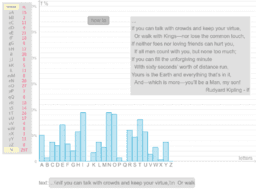
distribution of letters
pie chart
Practicing Statistical Calculation-1
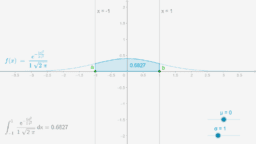
the bell curve
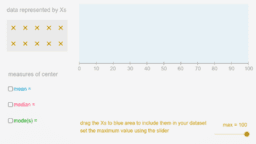
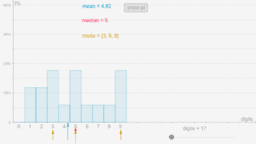
measures of center
pi digits
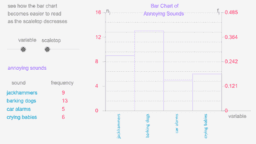
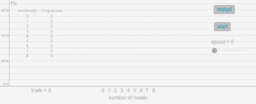
frequency scale
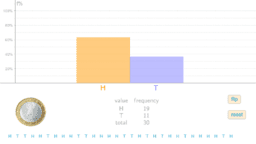
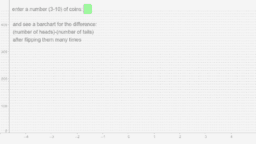
coin flipping-1
flipping a coin
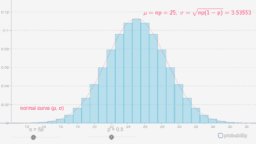
binomial and normal
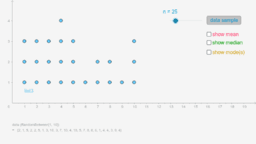
random data-1
random data-2
coin tossing simulation
dotplot
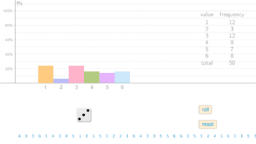
rolling a dice
rolling two dice
statistics
Author:
sonom
Topic:
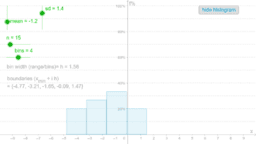
Histogram
,
Means
,
Median Value
,
Mode
,
Statistics
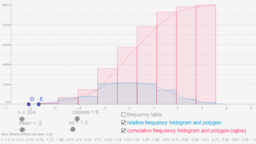
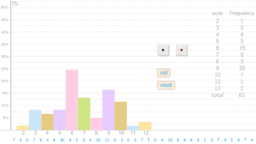
histograms
distribution of letters
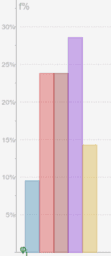
pie chart
Practicing Statistical Calculation-1
the bell curve
measures of center
pi digits
frequency scale
coin flipping-1
flipping a coin
binomial and normal
random data-1
random data-2
coin tossing simulation
dotplot
rolling a dice
rolling two dice
Next
histograms
New Resources
Lorenz Attractor: Multiple particles
Road Runner (beep, beep)
Monkey typing Shakespeare's complete works
Rings of circles
Periodic Functions
Discover Resources
test213
Forum_36047_A_clock
Linkage Simulator
shape
exterior Angle
Discover Topics
Subtraction
Hypothesis Testing
Calculus
Pythagoras or Pythagorean Theorem
Definite Integral