Google Classroom
GeoGebra
GeoGebra Classroom
Sign in
Search
Google Classroom
GeoGebra
GeoGebra Classroom
Outline
Graphing for Reflections Practice
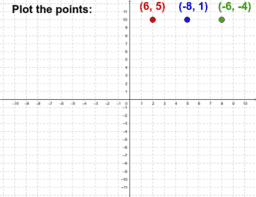
Plot Points
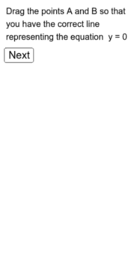
Lines representing equations of the form x = a and y = c
Graphing for Reflections Practice
Author:
Kevin Westrich
Topic:
Reflection
Plot Points
Lines representing equations of the form x = a and y = c
Next
Plot Points
New Resources
Average Rate of Change: Graph a Function (2)
Icosahedron1
Poorly Drawn Parallelograms
Poorly Drawn Parallelograms 3
Blancmange curve (fractal)
Discover Resources
intersection cylindre sphere
Visualizing Sine and Cosine
Ellipse Gardner's Construction
triangle_vector_moveCDAB&u&v&t
Slope: Intuitive Quiz Questions
Discover Topics
Combinatorics
Sphere
Root
Step Functions
Geometry