Google Classroom
GeoGebra
GeoGebra Classroom
Sign in
Search
Google Classroom
GeoGebra
GeoGebra Classroom
Outline
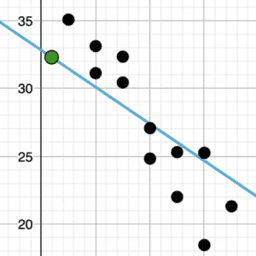
Describing Trends in Scatter Plots: IM 8.6.5
Lesson 8.6.5
Practice 8.6.5
Describing Trends in Scatter Plots: IM 8.6.5
Author:
GeoGebra Classroom Activities
,
IM 6 – 8 Math
Topic:
Algebra
,
Correlation
,
Equations
,
Linear Equations
,
Linear Regression
,
Scatter Plot
,
Statistics
“Describing Trends in Scatter Plots”
from IM Grade 8 by
Open Up Resources
and Illustrative Mathematics. Licensed under the
Creative Commons Attribution 4.0 license
.
Table of Contents
Lesson 8.6.5
IM 8.6.5 Lesson: Describing Trends in Scatter Plots
Practice 8.6.5
IM 8.6.5 Practice: Describing Trends in Scatter Plots
Next
IM 8.6.5 Lesson: Describing Trends in Scatter Plots
New Resources
Chaotic behaviour
aperiodic monotile construction_step by step
Average Rate of Change: Graph a Function (2)
Exploring the Derivative of an Exponential Function
Flip Flop
Discover Resources
Shawver Period 2 Christian Munn
Okręgi opisane na kwadracie
Pythagoras Disection 2
Αντιγραφή του Reflected beam at ellipse
CYCLIC QUADRILATERAL
Discover Topics
Right Triangles
Logic
Cone
Difference and Slope
Conditional Probability