Google Classroom
GeoGebra
GeoGebra Classroom
Sign in
Search
Google Classroom
GeoGebra
GeoGebra Classroom
Outline
Statistics
Box & Whisker vs. Histogram
Describing the Distribution (with Box plots)
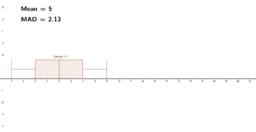
Box Plot Example - MAD
Statistics
Author:
Roberta Schroeder
Box & Whisker vs. Histogram
Describing the Distribution (with Box plots)
Box Plot Example - MAD
Next
Box & Whisker vs. Histogram
New Resources
Poorly Drawn Parallelograms 3
Poorly Drawn Parallelograms 2
Average Rate of Change: Graph a Function (2)
alg2_05_05_01_slider_practice_flvs
Parallelograms: Quick Investigation
Discover Resources
rotations page 1
Nasty Minimisation, second example
Конструкција на ромб со зададени страна и дијагонала
Net of pyramid
Modul 16B_Amrin_SMAN 2 Baubau
Discover Topics
Cylinder
Pythagoras or Pythagorean Theorem
Translation
Linear Programming or Linear Optimization
Algebra