Google Classroom
Google Classroom
GeoGebra
GeoGebra Classroom
Anmelden
Suche
Google Classroom
Google Classroom
GeoGebra
GeoGebra Classroom
Kapitel
Algebra 1
Statistics
Solving Linear Functions and Inequalities
Graphing Linear Functions
Writing Linear Functions
Algebra 1
Autor:
Thomas Gebbie
Thema:
Algebra
Inhaltsverzeichnis
Statistics
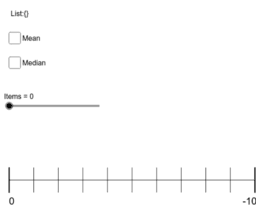
Dot Plot Generator
Box and Whisker Practice #2
Compare Box and Whisker Plots
Solving Linear Functions and Inequalities
Algebraic Proof Justification 1
Algebraic Proof Justification 2
Literal Equations Proof Justification
Graphing Linear Functions
Investigate the relationship between the three forms of line
First, use the sliders to create the parent function, y = x.
DIGI203-3D #8
Writing Linear Functions
Point Slope Form Matching
Slope Intercept Form Matching
Equivalent Linear Equations Matching
Weiter
Dot Plot Generator
Neue Materialien
z`]]
Some random function
Slope and Road Signs
Model sferyczny - dwunastościan-dwudziestościan
အခြေခံ data အခေါ်အဝေါ်များ
Entdecke Materialien
Bethany Allen
H Angle Sum of a Triangle
Deducing trig ratios for 0 and 90 degrees
Untitled
座標空間
Entdecke weitere Themen
Mittelwerte
Symmetrie
Stetigkeit
Kombinatorik
Ungleichungen