Contur
Graph of second degree function
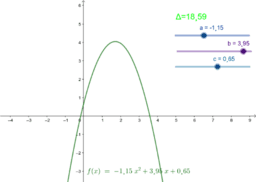
It contains the lesson plan "The Graph of the Grade II Function" and a GeoGebra application, built to facilitate the use of active methods such as directed discovery and problem-solving. The app helps students correlate the position and orientation of the parabola based on the dominant and discriminating coefficient. The variables/cursors a, b, and c, are displayed on the screen, which students can modify, causing the change of discriminant and of the parabola position. The application will be used for 15 to 20 minutes, while students work on notebooks or boards, learning together with the teacher.
