Google Classroom
Google Classroom
GeoGebra
GeoGebra Classroom
Abrir sesión
Buscar
Google Classroom
Google Classroom
GeoGebra
GeoGebra Classroom
Esquema
Pearson Maths A level Stats & Mechanics 1
Representations of data
Correlation
Statistical distributions
Hypothesis testing
Constant acceleration
Variable acceleration
Pearson Maths A level Stats & Mechanics 1
Autor:
Pearson Secondary Maths
A set of activities designed to be used in conjunction with exercises from Edexcel AS and A level Mathematics: Statistics & Mechanics Year 1/AS
Tabla de contenidos
Representations of data
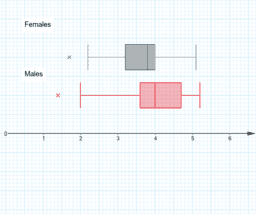
Box plots: page 44, example 3
Correlation
Correlation: page 64, example 3
Statistical distributions
Statistical distributions: page 93, example 7
Hypothesis testing
Hypothesis testing: page 103, example 4
Constant acceleration
Constant acceleration: page 134, example 3
Variable acceleration
Variable acceleration: page 183, example 3
Siguiente
Box plots: page 44, example 3
Nuevos recursos
Model sferyczny - sześcian-ośmiościan
גיליון אלקטרוני להעלאת נתוני בעיה ויצירת גרף בהתאם
seo tool
Some random function
Nikmati Keunggulan Di Bandar Judi Terpercaya
Descubrir recursos
Dan Huff's g
copy of unit circle all six trig functions
Rojos y azules
Mini-Quiz #11 Calculus The Fundamental Theorem and Displace
Exploring Radicals
Descubre temas
Números Complejos
Funciones escalonadas
Operaciones Aritméticas
Inecuaciones
Esfera