Google Classroom
Google Classroom
GeoGebra
GeoGebra Classroom
Sign in
Search
Google Classroom
Google Classroom
GeoGebra
GeoGebra Classroom
Outline
Statistics
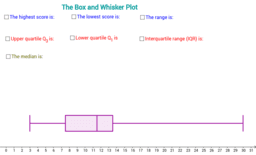
Box Plot
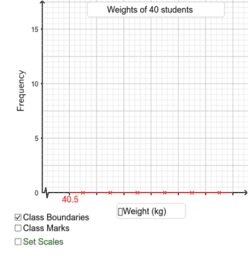
Drawing Histograms
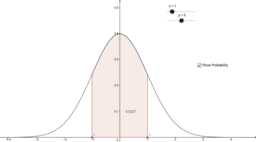
Altering the standard deviation and mean of the normal curve
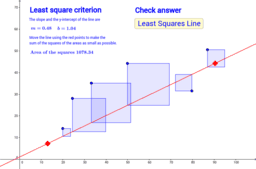
Least Squares Criterion
Statistics
Author:
Dr. Edgar
Box Plot
Drawing Histograms
Altering the standard deviation and mean of the normal curve
Least Squares Criterion
Next
Box Plot
New Resources
Fourier Lissajous (Mechanical)
Rose Curve
အခြေခံ data အခေါ်အဝေါ်များ
Damped Trochoidal Curve
Slope and Road Signs
Discover Resources
Coxeter- Exercise 3.1.1
derivaatta
test_ableitung
鐘面的時間(時和分)
angle
Baum Trapezoid
Evaluate the distance
Discover Topics
Tangent Function
Translation
Quadratic Functions
Ellipse
Special Points