Google Classroom
Google Classroom
GeoGebra
GeoGebra Classroom
Sign in
Search
Google Classroom
Google Classroom
GeoGebra
GeoGebra Classroom
Outline
Estatística
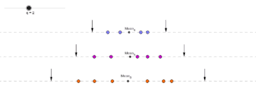
Statistical Outliers Impossible in Small Samples
Outlier Influence
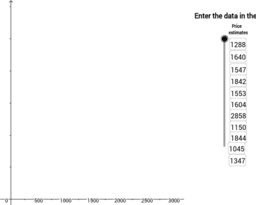
Estimate using Box Plot
Outliers
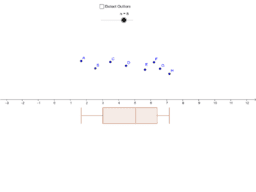
Dynamic Boxplot
Step Through Modified Boxplot Construction
Generate Two Boxplots
Boxplot Game
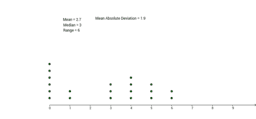
Mean, Median, and Standard Deviation
Dot Plot Interactive
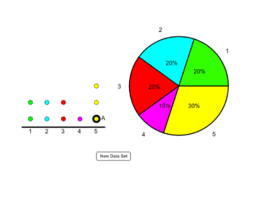
AQR Section 16: Creating a Pie Chart From a Dot Plot
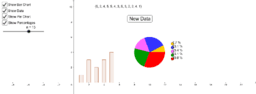
Bar Charts and Pie Charts
Dot Plot Tool
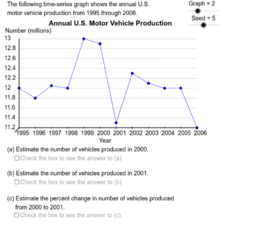
Time Series Analysis Problems
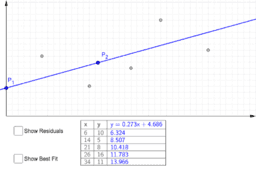
Least Squares Demonstration
Estatística
Author:
Palmerim
Statistical Outliers Impossible in Small Samples
Outlier Influence
Estimate using Box Plot
Outliers
Dynamic Boxplot
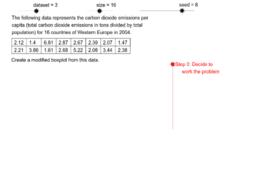
Step Through Modified Boxplot Construction
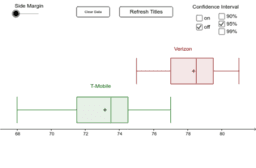
Generate Two Boxplots
Boxplot Game
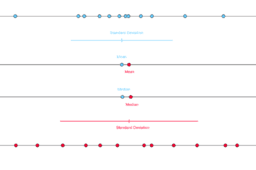
Mean, Median, and Standard Deviation
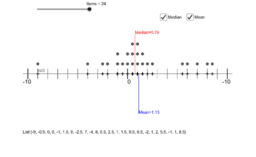
Dot Plot Interactive
AQR Section 16: Creating a Pie Chart From a Dot Plot
Bar Charts and Pie Charts
Dot Plot Tool
Time Series Analysis Problems
Least Squares Demonstration
Next
Statistical Outliers Impossible in Small Samples
New Resources
Exemplo de Botão que abre link
CUBO
soprador_tetra
pueblo para imprimir
círculo trigonométrico
Discover Resources
Concavidade da Parábola
Soma de Vetores
Derivada Função Polinomial
Ângulos internos e externos de polígonos
Tarefa 4
Discover Topics
Sine
Optimization Problems
Bar Chart or Bar Graph
Geometric Transformations
Conditional Probability