Google Classroom
Google Classroom
GeoGebra
GeoGebra Classroom
Abrir sesión
Buscar
Google Classroom
Google Classroom
GeoGebra
GeoGebra Classroom
Esquema
Quadratics
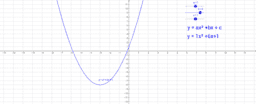
Graph y=x^2 + c
Quadratics
Autor:
Jean Maxstadt
Explore how the values of a, b, and c affect the graph.
Graph y=x^2 + c
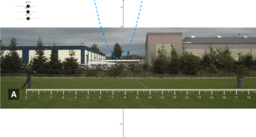
Ball in Can - Photo A
Explore how the values of a, b and c affect quadratic graph
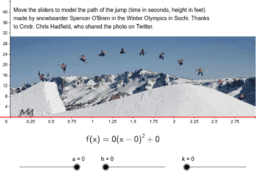
Olympic Quadratic Modeling with Sliders
Siguiente
Ball in Can - Photo A
Nuevos recursos
Rose Curve
רישום חופשי
Untitled
Random Polar Curve (3)
¿Quién llegará más lejos en el mundial?
Descubrir recursos
Transformations in the Plane
Untitled
Cone & Cylinder creared from Revolution의 복사본
Descubre temas
Triángulos Isósceles
Vectores
Geometría
Cono
Cálculo de intereses