Google Classroom
Google Classroom - Interaktiva lektioner
GeoGebra
GeoGebra Classroom - Interaktiva lektioner
Logga in
Sök
Google Classroom
Google Classroom - Interaktiva lektioner
GeoGebra
GeoGebra Classroom - Interaktiva lektioner
Utkast
Handling Data
Probability
Graphs
Averages
Handling Data
Författare/skapare:
HHAMaths
Innehåll
Probability
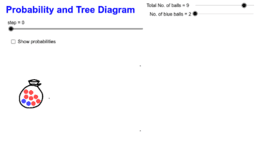
Probability and Tree Diagram
Conditional Probabilities and Independence
Experimental Probability Spinner
Copie de Probability and Tree Diagram
Graphs
Distance Time Graphs
Bar Charts and Pie Charts
Cumulative Frequency Properties
Scatter Graph
Averages
Box-and-Whisker Plot Generator
Mean Median
Nästa
Probability and Tree Diagram
Nya resurser
Cartesian vs Polar
အခြေခံ data အခေါ်အဝေါ်များ
רישום חופשי
Some random function
Rose Curve
Upptäck resurser
Bonilla T Bisecting Segments and Angles
reflection dilation
Reflect onto Itself 3 APS
Geometric Seq
Factor Theorem
Undersök matematisk områden
Differentialekvation
Funktioner
Multiplikation
Gränsvärden
Koordinater