Google Classroom
Google Classroom
GeoGebra
GeoGebra Classroom
Sign in
Search
Google Classroom
Google Classroom
GeoGebra
GeoGebra Classroom
Outline
AP Stats
AQR Section 17: Calculating Summary Statistics
AQR Section 16: Five Number Summary Exploration
AQR Section 17: Dot Plot and Box-and-Whisker Plot
AQR Section 17: Creating a Box and Whisker Plot
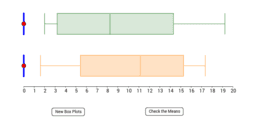
AQR Section 17: Where's the Mean?
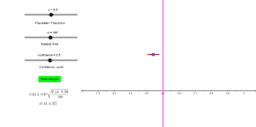
Confidence Interval for a Proportion
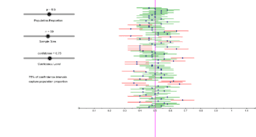
Exploring a Single Confidence Interval for a Proportion
AP Stats
Author:
Steve Phelps
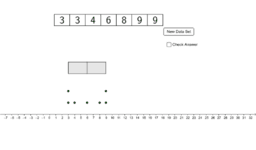
AQR Section 17: Calculating Summary Statistics
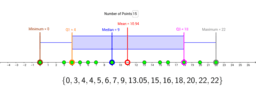
AQR Section 16: Five Number Summary Exploration
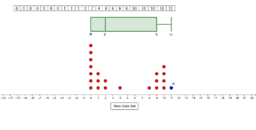
AQR Section 17: Dot Plot and Box-and-Whisker Plot
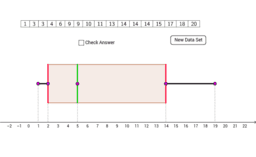
AQR Section 17: Creating a Box and Whisker Plot
AQR Section 17: Where's the Mean?
Confidence Interval for a Proportion
Exploring a Single Confidence Interval for a Proportion
Next
AQR Section 17: Calculating Summary Statistics
New Resources
רישום חופשי
Rose Curve
seo tool
Model sferyczny - dwunastościan-dwudziestościan
Damped Trochoidal Curve
Discover Resources
Trasformazioni_funzioni_trig
asgq53g 3g
Draw Square_summary
Constructing Conic Sections
Cos(x) & Unit Circle - Degrees
Match Point Problem
Discover Topics
Right Triangles
Perimeter
Volume
Diagrams
Quadrilaterals