Google Classroom
Google Classroom
GeoGebra
Classe GeoGebra
Se connecter
Chercher
Google Classroom
Google Classroom
GeoGebra
Classe GeoGebra
Contenu
Statistics Demonstrations
One Variable Statistics
Two Variable Statistics
Simulations
Probability Distributions
Randomizers
Other
Statistics Demonstrations
Auteur :
Jermaine Magee
,
George Sturr
Thème :
Statistiques
Table des matières
One Variable Statistics
AQR Section 17: Mean but Sensitive
AQR Section 6: Weighted Average Exploration
AQR Section 16: Five Number Summary Exploration
AQR Section 17: Where's the Mean?
AQR Section 17: Which Histogram has more Variation?
AQR Section 16: Matching a Pie Chart to a Dot Plot
Two Variable Statistics
Guess the Correlation!
Polynomial Curve Fit
Sampling from a population of ordered pairs
Sensistive r
Least Squares Demonstration
Simulations
Bag of Marbles
Coin Flip Simulation
Dice Roll Simulation
acertar en la diana - 3
Probability Distributions
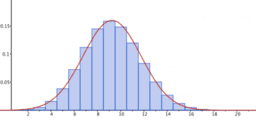
Normal Curve Demonstration
Binomial Distribution with Normal Approximation
Student-t vs. Z
Randomizers
Playing Card Dealer
Create Random Integer Lists
Spinner
Non-transitive Spinners
Flipping 5 Coins
Other
Chaos Game
Suivant
AQR Section 17: Mean but Sensitive
Nouvelles ressources
Slope Between 2 Points (Phase 2)
seo tool
Angle Addition: Warm Up Exercises
Model sferyczny - sześcian-ośmiościan
Nikmati Keunggulan Di Bandar Judi Terpercaya
Découvrir des ressources
text_colour 2
Mrs Yearwood
Properties of Circles
Copie de Angle of the Sun in the Sky (Any Place, Date & Time)
Dem linez
Pythagorean Inequality Thm Activity
Découvrir des Thèmes
Exposant
Solides de l'Espace
Fonctions Puissances
Équations Linéaires
Variance