Google Classroom
Google Classroom
GeoGebra
Classe GeoGebra
Se connecter
Chercher
Google Classroom
Google Classroom
GeoGebra
Classe GeoGebra
Contenu
Statistics Demonstrations
One Variable Statistics
Two Variable Statistics
Simulations
Probability Distributions
Randomizers
Other
Confidence Intervals
Statistics Demonstrations
Auteur :
Mike May
,
George Sturr
Thème :
Statistiques
My copy of George's book. Looking at ability to modify.
Table des matières
One Variable Statistics
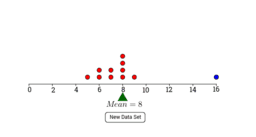
AQR Section 17: Mean but Sensitive
AQR Section 6: Weighted Average Exploration
AQR Section 16: Five Number Summary Exploration
AQR Section 17: Where's the Mean?
AQR Section 17: Which Histogram has more Variation?
AQR Section 16: Matching a Pie Chart to a Dot Plot
Two Variable Statistics
Guess the Correlation!
Polynomial Curve Fit
Sampling from a population of ordered pairs
Sensistive r
Least Squares Demonstration
Chi Squared worksheet
Example 3
Simulations
Bag of Marbles
Coin Flip Simulation
Dice Roll Simulation
acertar en la diana - 3
Sampling Distribution of the Mean
The Sampling Distribution
Confidence Interval for a Proportion
The Birthday Paradox Simulation
Probability Distributions
Normal Curve Demonstration
Binomial Distribution with Normal Approximation
Student-t vs. Z
Randomizers
Playing Card Dealer
Create Random Integer Lists
Spinner
Non-transitive Spinners
Flipping 5 Coins
Other
Chaos Game
Confidence Intervals
Proportion Confidence Interval
Mean Confidence Intervals
Finding P-value for proportion
Finding P-value for Sample Mean
Confidence Interval Variation Problems
Confidence Intervals for the Proportion and the Mean
Suivant
AQR Section 17: Mean but Sensitive
Nouvelles ressources
Cartesian vs Polar
Fourier Lissajous (Mechanical)
Model sferyczny - dwunastościan-dwudziestościan
Nikmati Keunggulan Di Bandar Judi Terpercaya
Viviani's Curve
Découvrir des ressources
Construct a Button!
кр
Trigonomtery Ratios
Area under curve 2
Slope Between 2 Points (Phase 2)
Découvrir des Thèmes
Aire
Fonctions Logarithmiques
Symétrie
Hyberbole
Vecteurs 3D (Espace)