Google Classroom
Google Classroom
GeoGebra
GeoGebra Classroom
Anmelden
Suche
Google Classroom
Google Classroom
GeoGebra
GeoGebra Classroom
Kapitel
Wahrscheinlichkeit/Statistik
Beschreibende Statistik
relative Häufigkeiten als Schätzung für Wahrscheinlichkeiten
W'-Probleme
Wahrscheinlichkeit/Statistik
Autor:
claudia.v.moser
Thema:
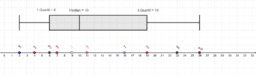
Boxplot oder Kastenschaubild
,
Kombinatorik
,
Wahrscheinlichkeit oder Wahrscheinlichkeitsrechnung
,
Statistik
Inhaltsverzeichnis
Beschreibende Statistik
Boxplot-Diagramm
relative Häufigkeiten als Schätzung für Wahrscheinlichkeiten
12.1Probability of Counters in a Bag
Würfeln und relative Häufigkeit
Würfeln und relative Häufigkeit
W'-Probleme
Ziegenproblem
Das Buffon'sche Nadelproblem
Weiter
Boxplot-Diagramm
Neue Materialien
Trixis Aufgabenchaos - Mittelmaße interpretieren
Zahlenmauer - Brüche multiplizieren
Mittelmaße und Ausreißer
Die drei Gesichter der homogen linearen Funktion (Wertetabelle, Funktionsgleichung, Graph)
Oberfläche einer Kugel - Näherung durch Vielecke
Entdecke Materialien
Obersumme Untersumme Integral
Szilassi Körper
Symmetriekreise von 2 Kreisen
Achterbahn Wasserwage
Hauptform der Graden
Entdecke weitere Themen
Kreisdiagramm oder Kuchendiagramm oder Tortendiagramm
Bedingte Wahrscheinlichkeit
Besondere Punkte
Treppenfunktionen
Logarithmus