Esboço
Interactive Exploration of Domain and Range
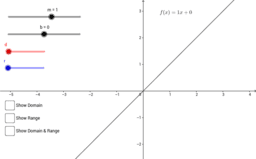
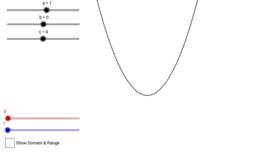
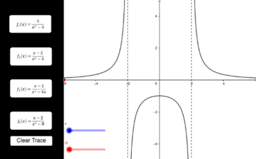
This GeoGebra book enables students to explore domain and range of a function, y = f(x). As the parameter a changes (using a slider), the corresponding point (a,f(a)) is plotted on the graph. Also, the points (a,0) and (0,f(a)) are plotted with a trace. The traces provide a visual for the domain and range and then students may express in terms of appropriate interval notation.
Functions Defined by Formulas
In this section you will explore domain and range for functions defined by formulas.