Google Classroom
Google Classroom
GeoGebra
GeoGebra Classroom
Sign in
Search
Google Classroom
Google Classroom
GeoGebra
GeoGebra Classroom
Outline
Probability & Intro. to Stat.
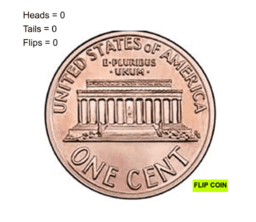
Randomly Flip a Coin
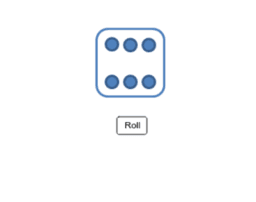
Roll Die Simulation
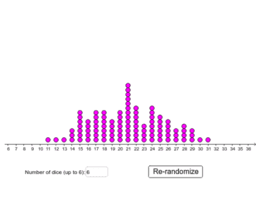
Dice
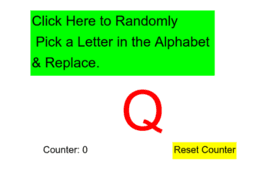
Randomly Pick Letter in Alphabet & Replace
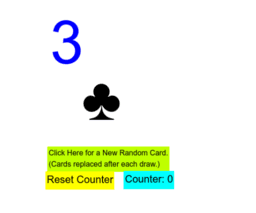
Randomly Pick a Card and Replace
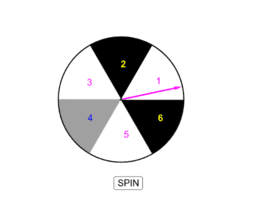
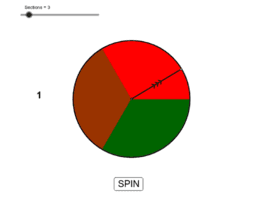
Spinner Six Sections (1 grey, 2 black, 3 white)
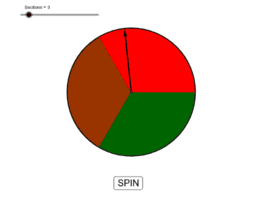
Spinner (2 to 12 sections) V1
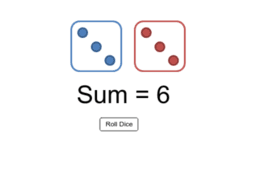
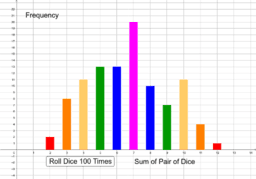
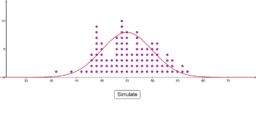
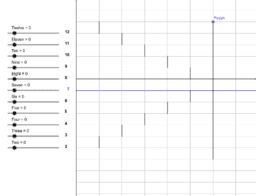
Simulation of Sum of Dice
Simulated Sums of Dice
Probability
Dice Roll Distribution
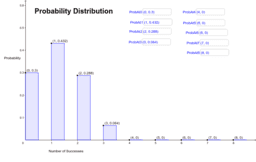
BJD Probability Distribution Tool : Optional Input
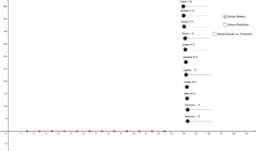
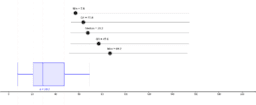
Boxplot Tool - Five Number Summary (0 to 200)
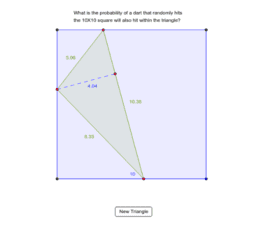
Probability Dart Hits Triangle
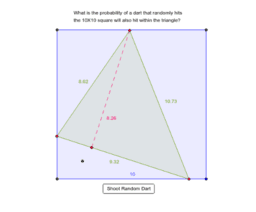
Random Darts Hit Triangle inside Square
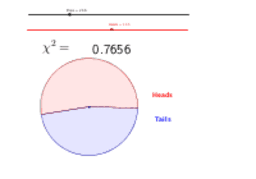
Chi Squared Goodness of Fit Flipping 1 Coin
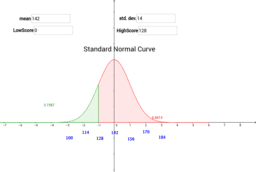
Normal Distribution: mean, std.dev.
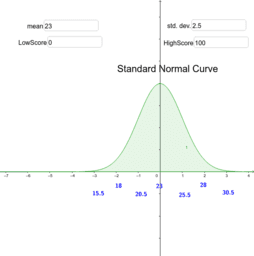
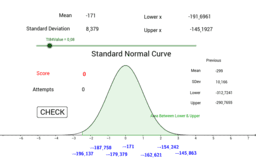
Standard Normal Curve
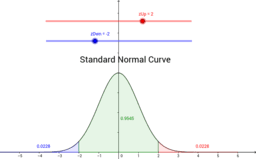
Standard Normal Curve Calculator: z-scores
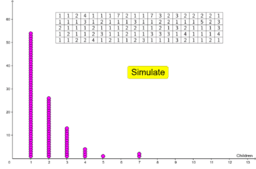
One Son Policy
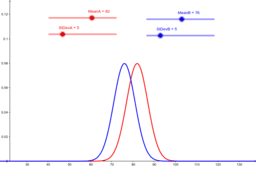
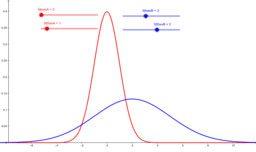
AHA Compare Two Normal Curves
AHE Compare Two Normal Curves 0<µ<5
AHG Normal Distribution of MPG & Weekly Cost
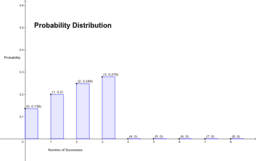
BJD Probability Distribution Tool
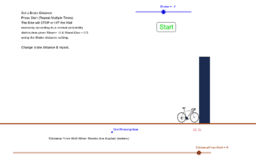
192 Normal Distribution Simulation : Bike & Wall
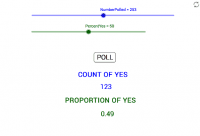
BJH Simulation of a Poll Given Population Percent
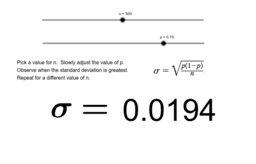
BAG Which Value of P Creates Greatest Sigma?
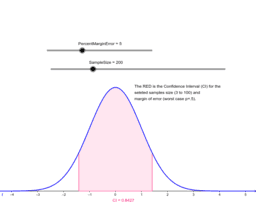
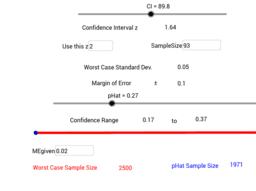
BEE Confidence Interval Given M.E. & Sample Size
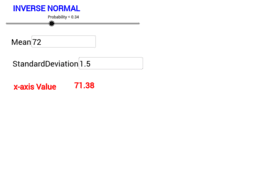
188 Inverse Normal Calculator
TI84 Normalcdf Practice Scored
Spinners (2 to 12 sections) V0 Instant
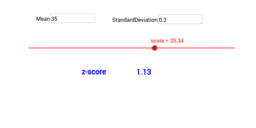
z-Scores
ME Given Sample Size: Sample Size Given ME
100 Trials of 100 Flips of a Fair Coin
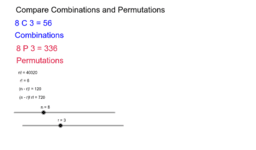
Compare Combinations & Permutations
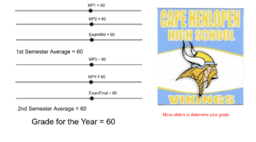
Calculate Grade for the Year
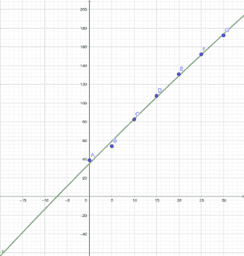
FIT Data to Quadratic v1
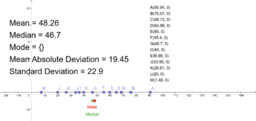
Task: Find Mean, Median, Range, Mean Absolute Deviation, Standard Deviation
Number Line Data Set & Statistics on The Data
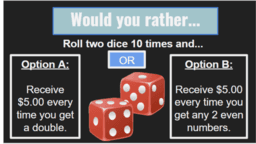
Doubles or Evens?
Horse Race Handicapped
Probability & Intro. to Stat.
Author:
Terry Lee Lindenmuth
Topic:
Probability
Probability Simulations and Demonstrations
Randomly Flip a Coin
Roll Die Simulation
Dice
Randomly Pick Letter in Alphabet & Replace
Randomly Pick a Card and Replace
Spinner Six Sections (1 grey, 2 black, 3 white)
Spinner (2 to 12 sections) V1
Simulation of Sum of Dice
Simulated Sums of Dice
Probability
Dice Roll Distribution
BJD Probability Distribution Tool : Optional Input
Boxplot Tool - Five Number Summary (0 to 200)
Probability Dart Hits Triangle
Random Darts Hit Triangle inside Square
Chi Squared Goodness of Fit Flipping 1 Coin
Normal Distribution: mean, std.dev.
Standard Normal Curve
Standard Normal Curve Calculator: z-scores
One Son Policy
AHA Compare Two Normal Curves
AHE Compare Two Normal Curves 0<µ<5
AHG Normal Distribution of MPG & Weekly Cost
BJD Probability Distribution Tool
192 Normal Distribution Simulation : Bike & Wall
BJH Simulation of a Poll Given Population Percent
BAG Which Value of P Creates Greatest Sigma?
BEE Confidence Interval Given M.E. & Sample Size
188 Inverse Normal Calculator
TI84 Normalcdf Practice Scored
Spinners (2 to 12 sections) V0 Instant
z-Scores
ME Given Sample Size: Sample Size Given ME
100 Trials of 100 Flips of a Fair Coin
Compare Combinations & Permutations
Calculate Grade for the Year
FIT Data to Quadratic v1
Task: Find Mean, Median, Range, Mean Absolute Deviation, Standard Deviation
Number Line Data Set & Statistics on The Data
Doubles or Evens?
Horse Race Handicapped
Next
Randomly Flip a Coin
New Resources
Model sferyczny - sześcian-ośmiościan
Angle Addition: Warm Up Exercises
Random Polar Curve (3)
Trefoil Knot
Nikmati Keunggulan Di Bandar Judi Terpercaya
Discover Resources
Circumcenter Example
Make your own Polar and Rectangular Graph
Extra Credit quiz 9
Polar Curves
פירוק תנועה לרכיבים
Стереометрия. Расстояние между прямыми
Discover Topics
Limits
Ratios
Incircle or Inscribed Circle
Cosine
Upper and Lower Sum or Riemann Sum