Google Classroom
Google Classroom
GeoGebra
GeoGebra Classroom
Anmelden
Suche
Google Classroom
Google Classroom
GeoGebra
GeoGebra Classroom
Kapitel
statistics
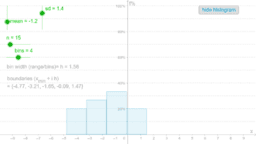
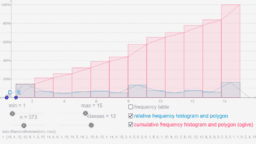
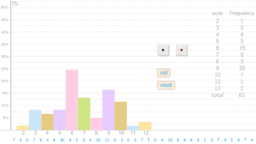
histograms
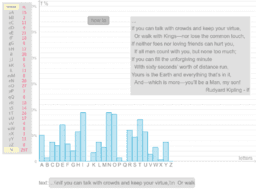
distribution of letters
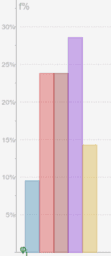
pie chart
Practicing Statistical Calculation-1
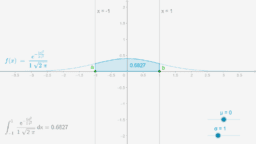
the bell curve
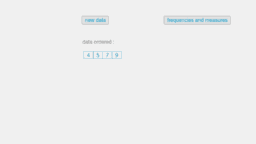
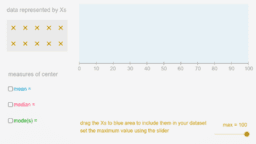
measures of center
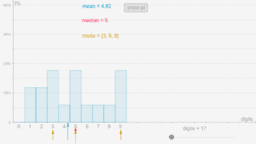
pi digits
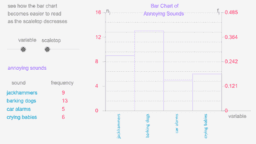
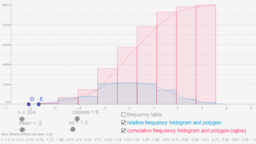
frequency scale
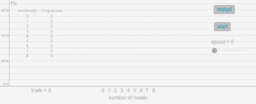
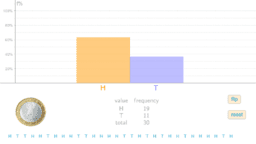
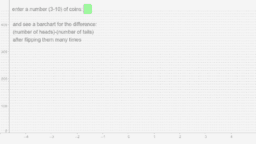
coin flipping-1
flipping a coin
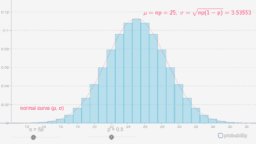
binomial and normal
random data-1
random data-2
coin tossing simulation
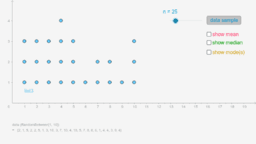
dotplot
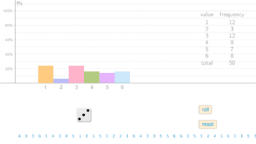
rolling a dice
rolling two dice
statistics
Autor:
Seddoh Marianne
,
sonom
histograms
distribution of letters
pie chart
Practicing Statistical Calculation-1
the bell curve
measures of center
pi digits
frequency scale
coin flipping-1
flipping a coin
binomial and normal
random data-1
random data-2
coin tossing simulation
dotplot
rolling a dice
rolling two dice
Weiter
histograms
Neue Materialien
Rose Curve
Slope Between 2 Points (Phase 2)
z`]]
Model sferyczny - sześcian-ośmiościan
Cartesian vs Polar
Entdecke Materialien
Стандарт нормаль тархалт
Quaternions for rotation
LanceMillergeogebra quiz
Untitled
Bubble
Entdecke weitere Themen
Differenzenquotient und Steigung
Ähnlichkeitstransformation oder Ähnlichkeitsabbildung oder Ähnlichkeit
Vektoren 3D (dreidimensional)
Graph
Prisma