Google Classroom
Google Classroom
GeoGebra
GeoGebra Classroom
Abrir sesión
Buscar
Google Classroom
Google Classroom
GeoGebra
GeoGebra Classroom
Esquema
Algebra 1
Statistics
Solving Linear Functions and Inequalities
Graphing Linear Functions
Writing Linear Functions
Algebra 1
Autor:
N.Andringa
,
Thomas Gebbie
Tema:
Álgebra
Tabla de contenidos
Statistics
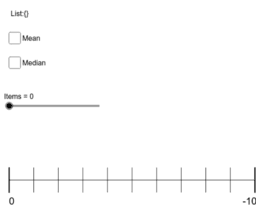
Dot Plot Generator
Box and Whisker Practice #2
Compare Box and Whisker Plots
Solving Linear Functions and Inequalities
Algebraic Proof Justification 1
Algebraic Proof Justification 2
Literal Equations Proof Justification
Graphing Linear Functions
Investigate the relationship between the three forms of line
First, use the sliders to create the parent function, y = x.
DIGI203-3D #8
Writing Linear Functions
Point Slope Form Matching
Slope Intercept Form Matching
Equivalent Linear Equations Matching
Siguiente
Dot Plot Generator
Nuevos recursos
apec
Slope and Road Signs
רישום חופשי
Random Polar Curve (3)
Untitled
Descubrir recursos
Octagon Island
Geocentrism and Heliocentrism
C3 Q9 Haf 2016 CBAC
p41-8
Lab : Absolute Value transformatioms
Descubre temas
Homotecia
Vectores 2D (dos dimensiones)
Conjuntos
Fractales
Funciones