Google Classroom
Google Classroom
GeoGebra
GeoGebra Classroom
Zaloguj się
Szukaj
Google Classroom
Google Classroom
GeoGebra
GeoGebra Classroom
Zarys
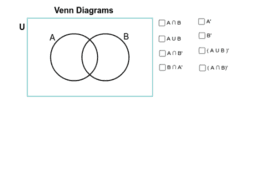
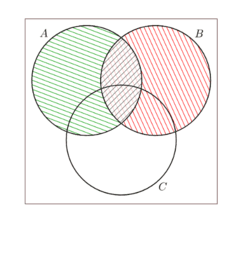
Venn Diagrams
Venn Diagrams
Illustrating set operations with Venn Diagrams
Venn Diagrams
Autor:
Kathryn Peake
Venn Diagrams
Illustrating set operations with Venn Diagrams
Następny
Venn Diagrams
Nowe zasoby
Hyperbolic Paraboloid
רישום חופשי
Rose Curve
Damped Trochoidal Curve
z`]]
Odkryj zasoby
Variable expressions with addition and subtraction
Mr. Smith's: Inscribed Angle Thm
LN freies Dreieck quadrieren,mit Schieberegler(3)
WJEC Maths 2018 A2 unit 4 Qu. 6
Magic Star, Pinwheel-Ring-Pinwheel by Robert Neale
Odkryj tematy
Pochodna
Deltoid
Zbieżność
Geometria fraktalna
Funkcje liniowe