로그인
검색
개요
Stats
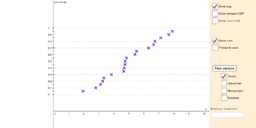
Normal probability plot
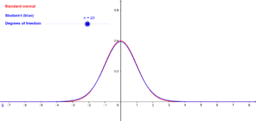
Comparison of the Student-t and Standard Nomal Distributions
Stats
저자:
ArmHacker
Normal probability plot
Comparison of the Student-t and Standard Nomal Distributions
다음
Normal probability plot
새 자료
¿Quién llegará más lejos en el mundial?
seo tool
Fourier Lissajous (Mechanical)
Angle Addition: Warm Up Exercises
Model sferyczny - dwunastościan-dwudziestościan
자료 찾기
Dilation Tool
Slider Tool
Conic
Line, line segment, and ray
กราฟของสมการเชิงเส้น
주제 찾기
대칭
각기둥
자연수
접선
미적분