Google Classroom
Google Classroom
GeoGebra
GeoGebra Classroom
Sign in
Search
Google Classroom
Google Classroom
GeoGebra
GeoGebra Classroom
Outline
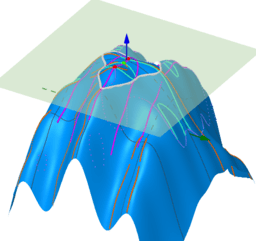
Contour Plots
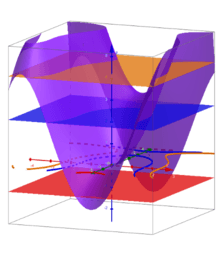
Contour plot and surface
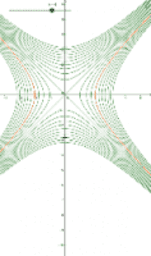
Function of several variables: several level curves
sin(x*y)+sin(x^2+y^2)- Images to Visualizing Functions of Two Variables
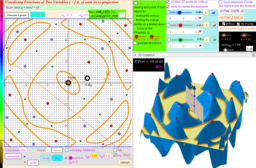
Visualizing Functions of Two Variables. Version 3
Contour Plots
Author:
Edward Wicks
Contour plot and surface
Function of several variables: several level curves
sin(x*y)+sin(x^2+y^2)- Images to Visualizing Functions of Two Variables
Visualizing Functions of Two Variables. Version 3
Next
Contour plot and surface
New Resources
Model sferyczny - dwunastościan-dwudziestościan
bewijs stelling van Pythagoras
רישום חופשי
Damped Trochoidal Curve
גיליון אלקטרוני להעלאת נתוני בעיה ויצירת גרף בהתאם
Discover Resources
Simplificação de frações
Circle and Tangent
三角函
พีระมิด
MODUL 3.6_SUKMA PERTIWI_SMPN 2 PANGKALPINANG
Discover Topics
Numbers
Cylinder
Calculus
Centroid or Barycenter
Orthocenter