Google Classroom
Google Classroom
GeoGebra
GeoGebra Classroom
Anmelden
Suche
Google Classroom
Google Classroom
GeoGebra
GeoGebra Classroom
Kapitel
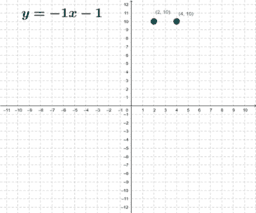
Graphing Lines y=mx+b
Graph the Line
Slope Intercept Form
Graphing Lines y=mx+b
Autor:
Brack Herald
Dragging a line to represent slope and y-intercept
Graph the Line
Slope Intercept Form
Weiter
Graph the Line
Neue Materialien
Model sferyczny - dwunastościan-dwudziestościan
Hyperbolic Paraboloid
¿Quién llegará más lejos en el mundial?
z`]]
גיליון אלקטרוני להעלאת נתוני בעיה ויצירת גרף בהתאם
Entdecke Materialien
Nets of 3-dimensional Shapes
Double Reflection and a Diagonal Translation
Geogebra1
Demonstrating Supplementary Angles
גיליון אלקטרוני להעלאת נתוני בעיה ויצירת גרף בהתאם
Entdecke weitere Themen
Geometrisches Mittel
Stochastische Prozesse
Kreis
Zufallsexperimente
Ebenen