Google Classroom
Google Classroom
GeoGebra
GeoGebra Classroom
Sign in
Search
Google Classroom
Google Classroom
GeoGebra
GeoGebra Classroom
Outline
Demo
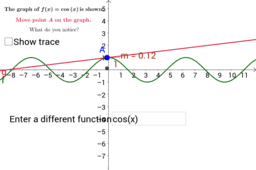
Visualize the graph of the derivative of a given function
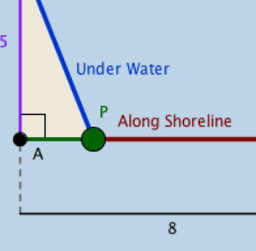
Oil Pipeline Optimization Problem
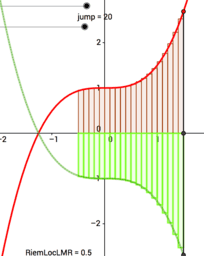
C0702 Volume Disk Method 3D Visual
Demo
Author:
Miriam Ramirez
Visualize the graph of the derivative of a given function
Oil Pipeline Optimization Problem
C0702 Volume Disk Method 3D Visual
Next
Visualize the graph of the derivative of a given function
New Resources
Some random function
Slope and Road Signs
Model sferyczny - dwunastościan-dwudziestościan
Cartesian vs Polar
רישום חופשי
Discover Resources
Diagonals of a rectangle
Law of Sines vs Law of Cosines
m11a_vektor_goodman_smak santo paulus jember
EX 74 PAGE 125
Inscribed Angle Theorem
Discover Topics
Normal Distribution
Rhombus
Definite Integral
LCM and GCD
Fractions