Google Classroom
Google Classroom
GeoGebra
GeoGebra Classroom
Abrir sesión
Buscar
Google Classroom
Google Classroom
GeoGebra
GeoGebra Classroom
Esquema
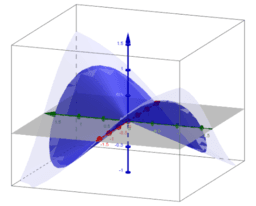
Visualization of limits of functions of two variables
Introduction
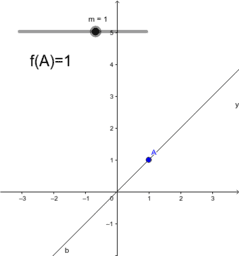
Example 1
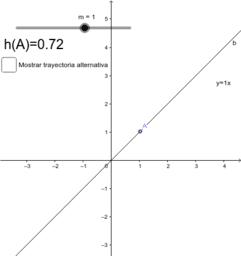
Example 2
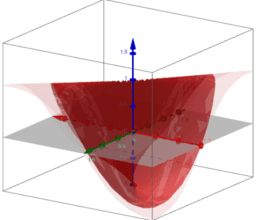
Example 3
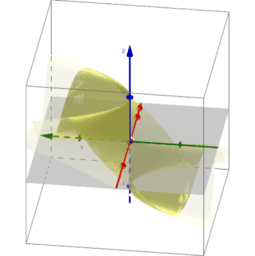
Polar coordinates: Example 1
Polar coordinates: Example 2
Polar coordinates: Example 3
Thank you very much
Visualization of limits of functions of two variables
Autor:
Laura del Río
Tema:
Funciones
,
Límites
Presentation for sharing at the GeoGebra Global Gathering 2017
Introduction
Example 1
Example 2
Example 3
Polar coordinates: Example 1
Polar coordinates: Example 2
Polar coordinates: Example 3
Thank you very much
Siguiente
Introduction
Nuevos recursos
רישום חופשי
Slope and Road Signs
Model sferyczny - sześcian-ośmiościan
Slope Between 2 Points (Phase 2)
¿Quién llegará más lejos en el mundial?
Descubrir recursos
QED Midsegment Proof
Math
פותר מערכת משוואות
MT1-03-P4a-XT2 Lateral Surface Area of a Cone
Vector Functions in 3-Space
Descubre temas
Cubo
Vectores
Prisma
Gráfico de Barras
Aritmética