Contenu
Mapping Diagrams: From AB to C&DE, Resource
Introduction: The more one studies mathematics, the more one encounters the concept of a function. By talking about functions we come to understand how they encode information. To bring a deeper understanding to functions we give them visual expression. Seeing the information of a function presented in a variety of forms helps us recognize more concretely some of its fundamental features.
These resource materials have been developed to help students understand functions more sensibly and deeply using four common ways to present the encoded information of a function. Students may have encountered some of these methods previously, but in this resource you will see how each of these methods give us different ways to view the same underlying relation.
The four ways that connect an understanding of functions are:
Tables of data for "variable" quantities.
Algebraic equations that determine a method for determining the value of (controlled or dependent) variable quantities uniquely from the value of other (controlling or independent) variable quantities.
The visualization of data for variable quantities using the Cartesian coordinate system.
The visualization of data for variable quantities using mapping diagrams.
For more textual connections see: http://users.humboldt.edu/flashman/MD/section-1.1VF.html
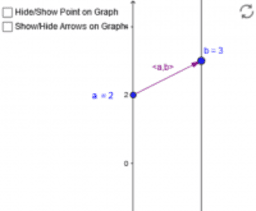
Table des matières
MD from AB to C&DE On-line Resource
Visualizing Functions
- reading.VFC.0
- Mapping Diagram (Real) from Function Table Activity
- Mapping Diagram Composition Adjust Arrows
- example.TGG.0
- example.DTA.0
- example.DTS.0
- example.DTCOM.0
- Mapping diagrams
- Mapping diagrams with adjustable output centre
- Mapping Diagram, Spreadsheet, Graph, Realign, Focus
- Visualizing Numeric Transformations
- Guess My Rule with MD
- VF.TSS.0.xls Spreadsheet
Linear Functions
- example.LF.DA.0.
- Example LF.2.1
- Example LF.2.2
- Example LF 2.3
- Example LF.2.4
- Example LF 2.5
- Example LF.4.1
- Example LF.4.2
- Example LF.DID.0
- example.LF.DFP.0
- example.LF.COMP.1.GG
- example.LF.DCOMP.0.
- example. LF.COMP.3 Composition of Core Linear Functions
- example.LF.INV.1.GG
- Example LF.INV.2
- Example LF.INV.3
- example.LF.DINV.0
- Example LF.FORM.1 Slope Intercept
- Example LF.Form.2. Point-Slope Form
- Example LF.FORM.2 Point-Slope Composition
- Example LF.FORM.3 Two Point Form
- Example LF.FORM.4 Point Slope Composition
- example.LF.DFORM.0
- Example LF.LEQ.1
- Example LF.LEQ.2 Solve Linear Equation (2)
- example.LF.LEQ.3.0
- example.LF.DLEQ.0
- Example.LF.DLEQ2.0 Solve f(x)=g(x) for Linear functions
- Example LInEQ.2
Quadratic Functions
- Example QF.FORM.1
- Example QF.FORM 2
- Example QF.FORM 3
- Example QF.FORM .4
- Example QF.FORM.n
- Example QF.2.1
- Example QF.2.2
- Example QF.2.3
- Example QF.2.4
- Example QF.3.1
- Example QF.3.2
- Example QF.COMP.2
- Example QF.FORM.DVComp
- example.QF.DVFORM.0
- example.QF.DSFORM.0
- example.QF.DID.0
- Example QF.INV.2i
- Example QF.INV.2ii
- Example QF.INV.3i
- Example QF.INV.3ii
- example.QF.DSYMM.0
- example.QF.INV.1.GG
- example.QF.DINV.0.1
- Example QEQ.0
- Example QEQ.1
- example.QF.DQEQ.0
- QF.QEQ.2.0
- Example QF.QInEQ.0
- Example QF.DQInEQ.0
Other Algebraic Functions
- example.OAF.RF.0
- Example OAF.PFF.1
- Example OAF.PFF.2
- Example OAF.PFF.3
- Example OAF.PFF.4
- example.OAF.DPFF.0
- example.OAF.DPSF.0
- example.OAF.RFF.1
- example.OAF.RFF.2
- example.OAF.RFF.3
- example.OAF.RFF.4
- Example OAF.COMP.1
- Example OAF.COMP.2
- Example OAF.COMP.3
- Example OAF.QCOMP.1
- Example OAF.QCOMP.2
- example.OAF.DRF.0
- example.OAF.CPPF.1.0.
- example.OAF.DSYMM.0
- example.OAF.BRF.1.0
- example.OAF.BRF.2.0
- example.OAF.BRF.3.0
- example.OAF.BRF.4.0
- example.OAF.SAE.1.0
- example.OAF.SAE.2.0
- example.OAF.DSAE.1.0
- example.OAF.DSAE.2.0
- example.OAF.CPPF.4.0
- example.OAF.CPPF.3.0
- example.OAF.CPPF.2.0
- example.OAF.CNPF.1.0
- example.OAF.CNPF.2.0
- example.OAF.CNPF.3.0
- example.OAF.CNPF.4.0
- example.OAF.DCPPF.0
- example.OAF.DCNPF.0
- example.OAF.DVNPF.0
- example.OAF.DVPPF.0
Other Ways to Define Functions
- example.OW.0
- example.OW.FDPC.1.0
- example.OW.FDPC.2.0
- example.OW.FDPC.3.0
- example.OW.FDPC.4.0
- example.OW.DFDPC.0
- example.OW.ICPPF.1.0
- example.OW.ICPPF.2.0
- example.OW.ICPPF.3.0
- example.OW.ICPPF.4.0
- example.OW.DICPPF.0
- example.OW.IMPL.3.0
- example.OW.IMPL.2.0
- example.OW.IMPL.1.0
- example.OW.DIMPL.1.0.A
- example.OW.DIMPL.1.0.B
- example.OW.RECF.1.0
- example.OW.RECF.2.0
- example.OW.RECF.3.0.
- example.OW.RECF.4.0
- Example OW.DRECF.0 a
- Example OW.DRECF.0 b
Exponential and Logarithmic Functions
- example.ELF.0
- example.ELF.CELF.1.0
- example.ELF.CELF.2.0
- example.ELF.CELF.3.0
- example.ELF.CELF.4.0
- ELF.LCELF.1.0
- example.ELF.DCELF.0.
- example.ELF.DOM.L.1.0
- example.ELF.DOM.L.2.0
- example.ELF.DOM.L.3.0
- example.ELF.DDOM.L.0
- example.ELF.NEL.1.0
- example.ELF.NEL.2.0
- example.ELF.NEL.3.0
- example.ELF.IDA.2.0
- example.ELF.DIDA.0
- example.ELF.AP.1.0.A
- example.ELF.AP.1.0.B
- example.ELF.AP.2.0.A
- example.ELF.AP.2.0.B
- example.ELF.AP.3.0.A
- example.ELF.AP.3.0.B
- proof.ELF.AP.P.1.0
- proof.ELF.AP.P.2.0
- proof.ELF.AP.P.3.0
- proof.ELF.AP.P.4.0
- example.ELF.LCELF.1.0
- example.ELF.LCELF.2.0
- example.ELF.LCELF.3.0
- example.ELF.DLCELF.0
- example.ELF.INV.1
- example.ELF.INV.2.A
- example.ELF.INV.2.B
- example.ELF.INV.3
- example.ELF.SEQ.1.0
- example.ELF.SEQ.2.0
- example.ELF.SEQ.E.3.0
- example.ELF.DSEQ.E.0
- example.ELF.SEQ.L.1.0
- example.ELF.SEQ.L.2.0
- example.ELF.SEQ.L.3.0
- example.ELF.DSEQ.L.0
Trigonometric Functions
- example.TRIG.0
- TRIG.MD.Deg.Rad.0.ggb
- TRIG.TRIDEF.2.ggb
- TRIG.TRIDEF.MD.ggb
- TRIG.circle.DEF.SCT.0.ggb
- TRIG.other.MD.Recip.0
- TRIG.circle.other.1
- Theorem.TRIG.SHAPE.1
- theorem.TRIG.SHAPE.2
- TRIG.Circle.SYM.0.1
- example.TRIG.DSYMM.0
- definition.InvTrigF.UnitCircle.ASIN
- definition.InvTrigF.UnitCircle.ACOS
- definition.InvTrigF.UnitCircle.ATAN
- definition.ITrigF
- theorem.TRIG.PERIOD,SC
- theorem.TRIG.PERIOD.TAN
- example.TRIG.DPB.0
- example.TRIG.SEQ.1.0.
- example.TRIG.SEQ.2.0
- example.TRIG.SEQ.3.0.
- Example SEQ.SC.4
- TRIG.MD All Solve Eqn.3
- TRIG.MD.ALLSolveGraph.0
- example.TRIG.ID.1.0
- example.TRIG.ID.2.0
- TRIG.DID.0
- TRIG.Circle.A*sin(Bx+C),A*cos(Bx+C).MD.0.1
- TRIG.Circle.A*tan(Bx+C)
- TRIG.MD.Graph.Table.Atrig(Bx+C)
- example.TRIG.COMP.1
- example.TRIG.COMP.2
- example.TRIG.COMP.3.0
- example.TRIG.COMP.4
- example.TRIG.LCOMP.1
- example.TRIG.LCOMP.2
- example.TRIG.LCOMP.3
- example.TRIG.LCOMP.4
- example.TRIG.SYM.1
- Example TRIG.SYM.2
- Example TRIG.SYM.3
- Example TRIG.SYM.4
- theorem.TRIG.TID
- Example.TRIG.SEQ.T.1
- Example.TRIG.SEQ.T.2
- Example TRIG.SEQ.T.3.
Algebra and Elementary Functions
- AEF. example.1
- AEF.Example.2
- Example AEF.0
- Mapping Diagrams and Graphs for Arithmetic Operations
- Mapping Diagrams (I) for Arithmetic operations to create new functions from old.
- Mapping Diagrams (II) for Arithmetic Operations
- example.AEF.COMP.1.
- example.AEF.COMP.2.
- example.AEF.DCOMP.0.
- Example AEF.MR.1
- Example AEF.DR.1
- Example AEF.SR.1
- Example AEF.ERU.1
- AEF.CSS Composition: Socks and Shoes
- Example AEF.NEB Numerical Estimation Bisection
- AEF.NEFP Numerical Estimation False Position
- Example AEF.NENS Newton Secant Method
- Example AEF.NEC Numerical Estimation Comparison
- Mapping diagrams - composite functions
- AMATYC 2017: Using Mapping Diagrams to Make Sense of Functions and Equations
Calculus I: Continuity & Differentiation
- Example.CCD.DDF.1
- Example CCD.CCF.2
- CCD.DDS.R. Example.2. Singularities with a root function.
- Example CCD.DLC.4
- Example CCD.DLC.1
- Example CCD.DCL.3
- CCD.UL: Uniqueness of Limits.Theorem and Proof
- Calculus of Limits
- Theorem: CCD.IVT.0:
- CH1F.ii.Figure 6
- CDD.DSMD0: The Derivative of the Sine at x=0: sin'(0)=1
- CDD.DCMD0 The Derivative of the Cosine at x=0: cos'(0)=0.
- CCD.DSMD: The derivative of the sine and cosine functions
- CCD.DDN4S: Four Steps to Find The Derivative
- CCD.DE exp'(0)estimated with h>0.
- CCD.DEMD.0: exp'(0)=1
- CCD.DPN Derivatives for Power Functions (n=1,2,3,...)
- CCD.DPZ Derivative of Powers for n= -1,-2,-3,...
- CCD,MVT The Mean Value Theorem
Calculus II: Diff'l Eq'ns, Integration & Series
- CIS.EM.TMD. Diff'l Eq'ns: Euler's Method, Mapping Diagrams, Slope Fields
- CIS.EM. Differential Equations: Mapping Diagram,Slope Field, Solution
- CIS.VDI. The Riemann Integral: Mapping Diagram and Graph
- CIS.PDI. Properties of the Definite Integral
- CIS:PSPDI "Proof" of Sum Property for the Definite Integral
- CIS.PSMPDI Scalar Multiple Property "Proof"
- CIS.PAPDI "Proof" of Additive Property of Definite Integral
- CIS.VMVTI Visualizing the Mean Value Theorem for Integral and its Proofs
- CIS.FTCD The Fundamental Theorem of Calculus (Derivative)
Calculus III: Multivariable Functions and Calculus
Complex Functions and Calculus