Google Classroom
Googleクラスルーム
GeoGebra
GeoGebra Classroom
ログイン
探す
Google Classroom
Googleクラスルーム
GeoGebra
GeoGebra Classroom
概要
Statistics
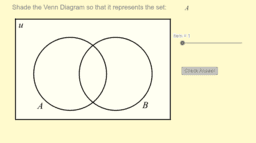
Sets and Venn Diagrams (2 Sets)
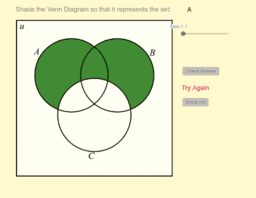
Venn Diagram (3 Sets)
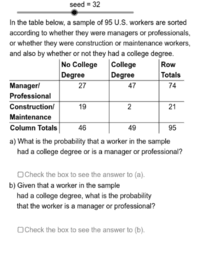
Computing Probabilities from Tables
Statistics
作成者:
Kevin Moore
Sets and Venn Diagrams (2 Sets)
Venn Diagram (3 Sets)
Computing Probabilities from Tables
次へ
Sets and Venn Diagrams (2 Sets)
新しい教材
Slope and Road Signs
Random Polar Curve (3)
Some random function
Rose Curve
רישום חופשי
教材を発見
Battle Ship
GPserge
Caixa
Exercise 5
Profit and Loss after Discount
トピックを見つける
不等式
移動・変換
単位円
ひし形
中線