Google Classroom
Google Classroom
GeoGebra
Classe GeoGebra
Se connecter
Chercher
Google Classroom
Google Classroom
GeoGebra
Classe GeoGebra
Contenu
ATC Cobwebs and Linear Difference Equations
Whistle Wetters
What is a Cobweb Diagram?
Different Growth Rates
ATC Cobwebs and Linear Difference Equations
Auteur :
Steve Phelps
Thème :
Equations
this is for the ATC Webinar.
Table des matières
Whistle Wetters
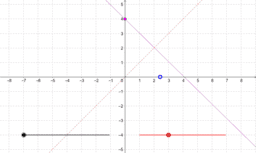
ATC Cobweb Diagram Webinar Whistle-Wetter
ATC Cobweb Diagram Webinar Whistle-Wetter #2
What is a Cobweb Diagram?
What is a Cobweb Diagram?
Different Growth Rates
r < –1
r = –1
-1 < r < 0
r = 0
0 < r < 1
r = 1
r > 1
–3 < r < 3
Suivant
ATC Cobweb Diagram Webinar Whistle-Wetter
Nouvelles ressources
Some random function
Cartesian vs Polar
Untitled
Model sferyczny - dwunastościan-dwudziestościan
Hyperbolic Paraboloid
Découvrir des ressources
Perpendicular Line
Tchirnhausen Cubic
Curve Sketching Example
Copie de TP sur le théoème des valeurs intermediaires
Découvrir des Thèmes
Symétrie
Vecteurs
Division
Suites et Séries
Périmètre