Google Classroom
Google Classroom
GeoGebra
GeoGebra Classroom
Kirjaudu
Haku
Google Classroom
Google Classroom
GeoGebra
GeoGebra Classroom
Luonnos
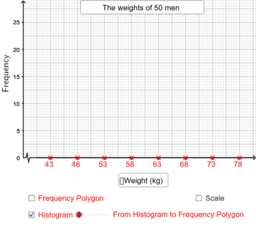
Simple Statistical Graphs
From Histograms to Frequency Polygons
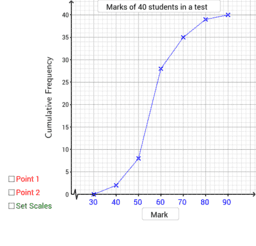
Cumulative Frequency Polygon
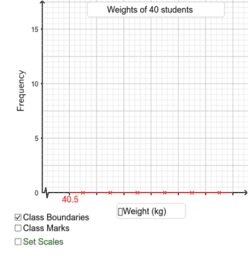
Drawing Histograms
Simple Statistical Graphs
Tekijä:
Alexander Lau
From Histograms to Frequency Polygons
Cumulative Frequency Polygon
Drawing Histograms
Seuraava
From Histograms to Frequency Polygons
Uusia resursseja
seo tool
גיליון אלקטרוני להעלאת נתוני בעיה ויצירת גרף בהתאם
Rose Curve
bewijs stelling van Pythagoras
Trefoil Knot
Löydä Materiaaleista
fbdyeah
Tara_Stumpf_Qtr1project_O3
Centers of Triangles
Properties of Rectangles on a Coordinate Grid
Löydä aiheita
Derivaatta
Neliö
Monikulmiot
Pythagoras tai Pythagoraan lause
Tasakylkinen kolmio