Google Classroom
Google Classroom
GeoGebra
GeoGebra Lesson
Sign in
Search
Google Classroom
Google Classroom
GeoGebra
GeoGebra Lesson
Outline
AP Statistics
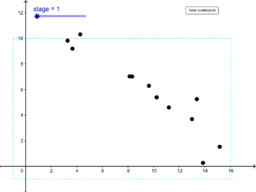
Draw line of best fit
AP Statistics
Author:
Lee Brown
Topic:
Statistics
Draw line of best fit
Next
Draw line of best fit
New Resources
Conditional Probability in Two-Way Tables
Rotating Custom Polygons Around an Axis
Choosing a Method to Find Triangle Area
Midpoint Theorem (V2): Integer Solutions
Modifiable Right Triangular Prism
Discover Resources
Powers of i
Mr.Perez Triform with text
Construction 12 - Tran
pg 42 example 1
triangle-trace 02
Discover Topics
Frequency Distribution
Vectors 3D (Three-Dimensional)
Polygons
Linear Regression
Power Functions