Google Classroom
Google Classroom
GeoGebra
GeoGebra Ders
Giriş yap
Ara
Google Classroom
Google Classroom
GeoGebra
GeoGebra Ders
Bölüm taslağı
Statistics Activities
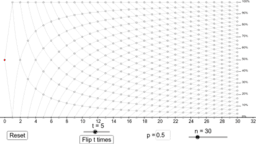
Random Flipping of Coins
Linear Regression
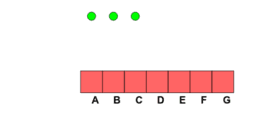
Dot Plot Interactive
Linear Regression with Random Set of Points
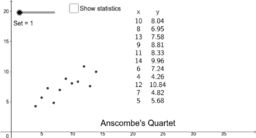
Anscombe's Quartet
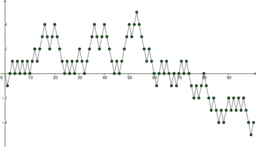
Stirling Recording Chart
A Coin Tossing Experiment
Hide and Peek
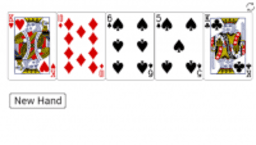
Playing Card Tool (SVG)
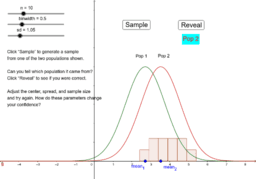
Guessing the Population from the Sample
Slope Simulation
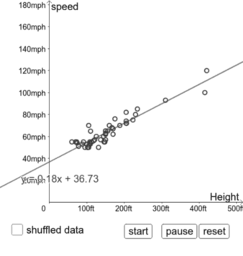
NCTM COASTER DATA
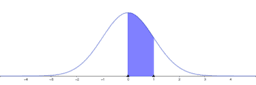
Normal distribution
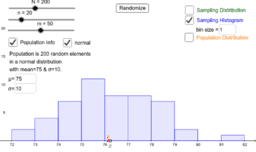
Sampling Distribution
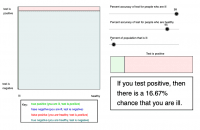
The Danger of False Positives
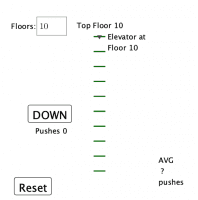
Broken Elevator
The Datasaurus Dozen
Statistics Activities
Yazar:
John Golden
sketches that use, apply, or create a context for statistical thinking.
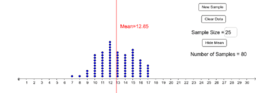
Random Flipping of Coins
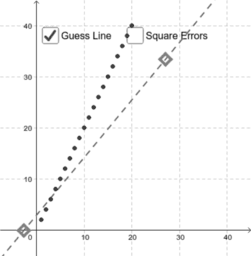
Linear Regression
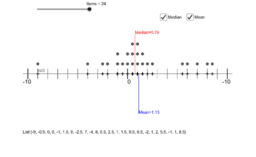
Dot Plot Interactive
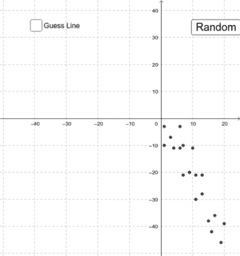
Linear Regression with Random Set of Points
Anscombe's Quartet
Stirling Recording Chart
A Coin Tossing Experiment
Hide and Peek
Playing Card Tool (SVG)
Guessing the Population from the Sample
Slope Simulation
NCTM COASTER DATA
Normal distribution
Sampling Distribution
The Danger of False Positives
Broken Elevator
The Datasaurus Dozen
Sonraki
Random Flipping of Coins
Yeni Kaynaklar
The Coordinate Plane (Cartesian Plane)
AI for Math Teachers (prompt examples)
Parallel Lines & Related Angles: Quick Reminders
Tangent Plane to a Sphere
ANGLE
Kaynakları Keşfet
Angles 4
kare
Charged Particles in a Magnetic Field - Intro Lab 1
Rectangle 745
O'HaraRhombus
Find circumcenter
Konuları Keşfet
Çevre Uzunluğu
Eğri Çizimi
Katı Cisimler veya 3D Şekiller
Prizma
Özel Noktalar