Google Classroom
Google Classroom
GeoGebra
Classe GeoGebra
Se connecter
Chercher
Google Classroom
Google Classroom
GeoGebra
Classe GeoGebra
Contenu
Statistics Step Through Applets
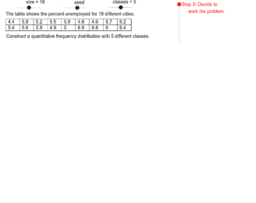
Step Through Quantitative Freq. Dist. Construction
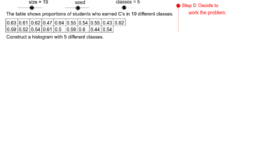
Step Through Histogram Construction
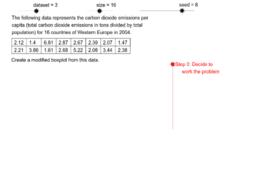
Step Through Modified Boxplot Construction
Step Through Basic Statistics with TI 83/84 Calculator
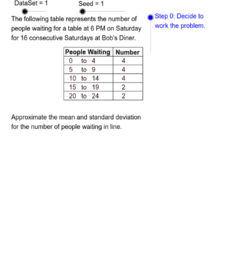
Step Through Mean & Standard Deviation of Grouped Data
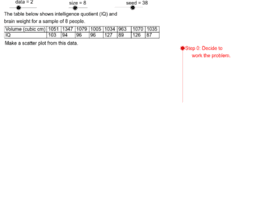
Step Through Scatter Plot Construction
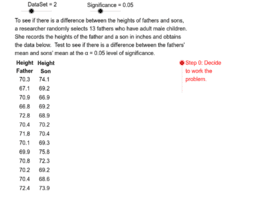
Step Through Dependent Difference Test
Step Through Goodness of Fit Test
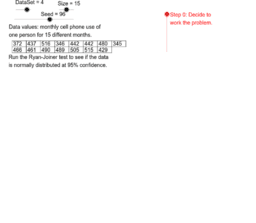
Step Through Ryan-Joiner Test
Statistics Step Through Applets
Auteur :
David Gurney
Thème :
Statistiques
These applets show the steps involved in doing some standard procedures of elementary statistics.
Step Through Quantitative Freq. Dist. Construction
Step Through Histogram Construction
Step Through Modified Boxplot Construction
Step Through Basic Statistics with TI 83/84 Calculator
Step Through Mean & Standard Deviation of Grouped Data
Step Through Scatter Plot Construction
Step Through Dependent Difference Test
Step Through Goodness of Fit Test
Step Through Ryan-Joiner Test
Suivant
Step Through Quantitative Freq. Dist. Construction
Nouvelles ressources
גיליון אלקטרוני להעלאת נתוני בעיה ויצירת גרף בהתאם
seo tool
Slope Between 2 Points (Phase 2)
Cartesian vs Polar
bewijs stelling van Pythagoras
Découvrir des ressources
test200
Perpendicular to the centre from a chord
The sum of a number and its reciprocal
Forum_29942_A
Vector_Basics_02
Messing With Mona_hayqua
Rotacija trapeza
Découvrir des Thèmes
Volume
Termes
Cercle Inscrit ou Circonscrit
Exposant
Parallélogramme