Google Classroom
Google Classroom
GeoGebra
GeoGebra Classroom
Bejelentkezés
Keres
Google Classroom
Google Classroom
GeoGebra
GeoGebra Classroom
Áttekintés
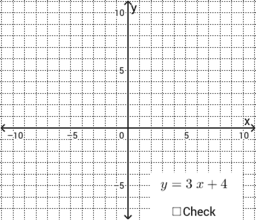
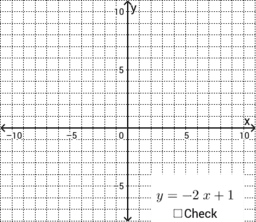
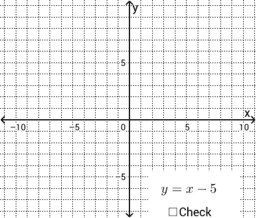
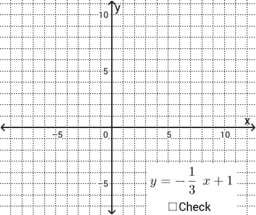
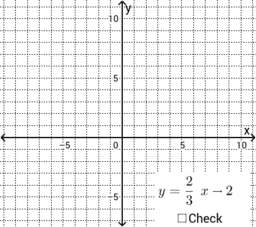
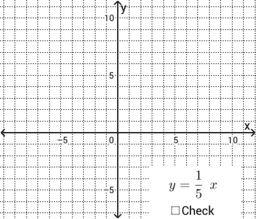
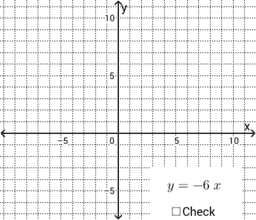
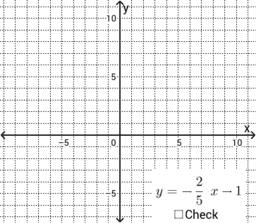
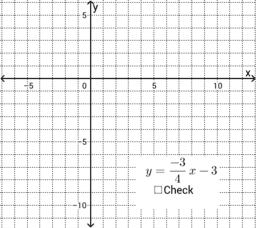
Graphing Lines with y=mx+b
a
b
c
d
e
f
g
h
Make Your Own Graph
Graphing Lines with y=mx+b
Szerző:
Brett Bellaire
a
b
c
d
e
f
g
h
Make Your Own Graph
Következő
a
Új anyagok
¿Quién llegará más lejos en el mundial?
Random Polar Curve (3)
Trefoil Knot
Damped Trochoidal Curve
အခြေခံ data အခေါ်အဝေါ်များ
Anyagok felfedezése
p3m1 (kaleidoscope 60)
Skytypers
Tessellation #2 Part 6
Tangent
Témák felfedezése
Görbeillesztés
Forgatás
Komplex számok
Derékszögű háromszög
Vektorok