Google Classroom
Google Classroom
GeoGebra
Classe GeoGebra
Se connecter
Chercher
Google Classroom
Google Classroom
GeoGebra
Classe GeoGebra
Contenu
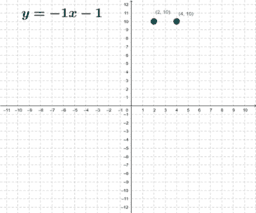
Graphing Lines y=mx+b
Graph the Line
Slope Intercept Form
Graphing Lines y=mx+b
Auteur :
Szotákné Tóth Márta
,
Brack Herald
Dragging a line to represent slope and y-intercept
Graph the Line
Slope Intercept Form
Suivant
Graph the Line
Nouvelles ressources
Rose Curve
z`]]
apec
Fourier Lissajous (Mechanical)
Nikmati Keunggulan Di Bandar Judi Terpercaya
Découvrir des ressources
Emmanuel - Triangles
Pre-Calculus
Mapping #5
สมการเชิงเส้น2ตัวแปร
Algebra 2 Diagnostic Unit 1
Découvrir des Thèmes
Valeur Attendue
Coordonnées
Mode
Trigonometrie
Droite Sécante ou Sécante