y = mx + c using AR with printable worksheet
Printable Worksheet

Instructions
1. Enable AR in the 3D calculator on your smartphone or tablet's GeoGebra app. You can find and open this activity in the app by searching for the following code: b9msqrzx.
2. Aim your device’s camera over the left-hand grid on the page entitled “Grids for Matching your Device’s AR Grid”. Select a point on the camera screen, using your index finger, for the origin of the (3D) axes.
3. "Pinch" the virtual grid with your index finger and thumb so that you can shrink or expand it and rotate it to line up with the real one. This bit is tricky!
4. Release pinch gently when in position.
5. Now you are ready to move the sliders  ...see what happens when you vary m and c? What effect does that have? What do they describe or measure?
...see what happens when you vary m and c? What effect does that have? What do they describe or measure?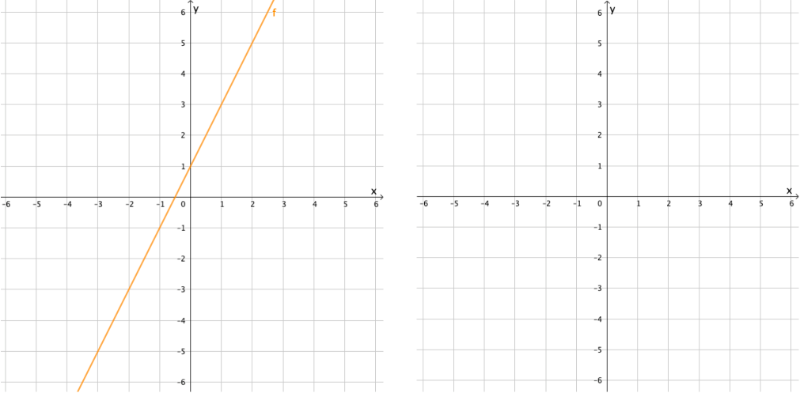
Extension Task 1 - Find the Equation of a Line Intersecting Points using AR
1. Now we will use the (real) blank grid on the right-hand side of the same page. On that grid, physically use a pen or pencil to plot the following coordinates:
(0,1)
(2, 2)
(6,4)
2. (If you were using the left-hand grid before), press the "3D" button on your device to toggle back to the 3D view without AR. This will enable you to fix the axes to the blank grid: move your device over to it, then enable AR again, repeating the above steps until you have matched the virtual and real grids as before.
3. Experiment with the sliders to see if you can find a straight line that intersects these three points.
4. What is the equation of this line?
5. Can you use this equation to find another two points on the line? See if you can make one of those points appear in the quadrant where both x and y are negative.
N.B. You can also enter those coordinates, as they are written, into the virtual grid on your device - they should appear as dots in the same places!
Extension Task 2 - Instructions for Content Creation
If you wish to construct the line only in the 3D GeoGebra Graphing Calculator app on your smartphone or tablet, you will need to project a vertical plane generated by the equation "y = mx + c" onto the x-y plane:
1. Open the app.
2. Ensure you are in "Algebra" view (select "Algebra" on the bottom-left of the screen).
3. Click where it says "Input..." and type in the equation "y=mx+c" and press return (you will need to select the "ABC" menu to write the m and c; the other characters are available in the "123" menu).
4. A vertical plane should appear, intersecting the x-y plane with a straight line.
5. To mark that line, toggle view to "Tools" (select "Tools" on the bottom-right of the screen) and select "Intersect Two"  . Now simply select both the vertical plane and the (grey) x-y plane.
6. To hide the vertical plane, go back to "Algebra" view and click on the coloured bullet-point toggle to the left of your equation "y=mx+c".
7. Note that sliders for m and c were automatically created when you entered the equation of a straight line. You can move the sliders and achieve the effects in the above applet. If you change the 3D orientation with your finger and enable AR, you can try to line up the x-y plane with the left-hand printed grid on same sheet, as in the previous task. Can you find the equation of the orange line (hint: look at the "Algebra" once you have replicated it in your device)?
In order to customise your view:
8. To hide the grey horizontal x-y plane, change settings by clicking on the black cogwheel icon on the top-right of the screen. Toggle the "Show Plane" button. You can also toggle the "Show Grid" button for the grid.
9. See if you can also un-colour the axes and fix the numbered interval distances on each axis to 1 - which settings option will enable this?
10. You can alter the sliders' properties (name, Min and Max, increment, colour etc.) by clicking on the three vertical dots to the right of the slider). You can alter the marked line's properties in the same way.
11. You can also colour the marked line by selecting it with your finger and using the flood icon to the left of the menu that appears at the top of the screen. A colour palette will appear for you to choose from. What else can you do to this line?
. Now simply select both the vertical plane and the (grey) x-y plane.
6. To hide the vertical plane, go back to "Algebra" view and click on the coloured bullet-point toggle to the left of your equation "y=mx+c".
7. Note that sliders for m and c were automatically created when you entered the equation of a straight line. You can move the sliders and achieve the effects in the above applet. If you change the 3D orientation with your finger and enable AR, you can try to line up the x-y plane with the left-hand printed grid on same sheet, as in the previous task. Can you find the equation of the orange line (hint: look at the "Algebra" once you have replicated it in your device)?
In order to customise your view:
8. To hide the grey horizontal x-y plane, change settings by clicking on the black cogwheel icon on the top-right of the screen. Toggle the "Show Plane" button. You can also toggle the "Show Grid" button for the grid.
9. See if you can also un-colour the axes and fix the numbered interval distances on each axis to 1 - which settings option will enable this?
10. You can alter the sliders' properties (name, Min and Max, increment, colour etc.) by clicking on the three vertical dots to the right of the slider). You can alter the marked line's properties in the same way.
11. You can also colour the marked line by selecting it with your finger and using the flood icon to the left of the menu that appears at the top of the screen. A colour palette will appear for you to choose from. What else can you do to this line?