Mercatorprojectie
wereldkaart
De uitdaging die Mercator aanging was de portulanen zodanig aan te passen dat ze hoekgetrouw werden, zodat de loxodromen afgebeeld werden als rechte lijnen.
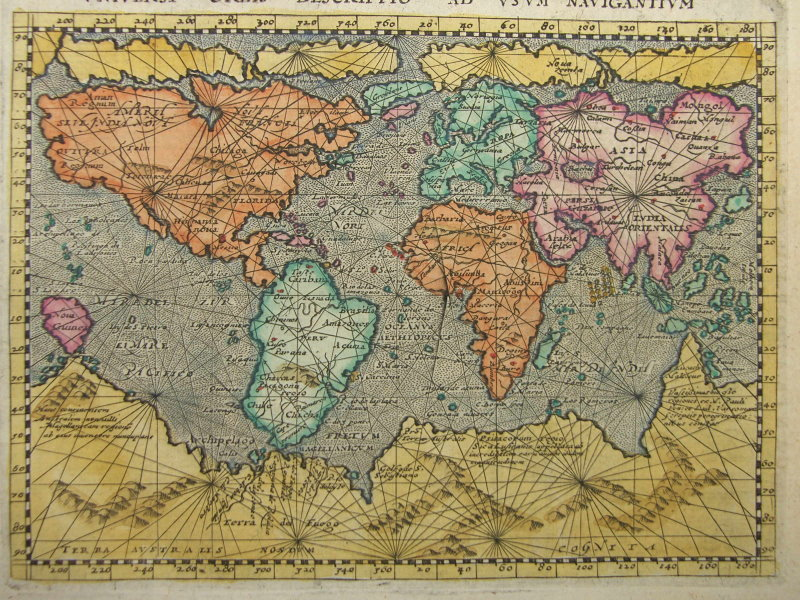
In 1569 publiceert hij zijn wereldkaart Nova et aucta orbis terræ descriptio ad usum navigantium emendate accommodata. (nieuwe en actuele beschrijving van de wereld voor gebruik in de navigatie in een passende hervorming). Hiervoor gebruikt hij zijn Mercatorprojectie, een cilindrische projectie die hem wereldberoemd zal maken.
Hij vertrekt hierbij van een cilinderprojectie waarbij de evenaar en de breedtecirkels evenwijdige, horizontale lijnen zijn en de meridianen verticale lijnen.
world map
The challenge for Mercator was to adapt the portolan charts so that they showed thrue angles and loxodromes appeared as straight lines.
In 1569 he publishes his world map Nova et aucta orbis terræ descriptio ad usum navigantium emendate accommodata. (new and actual description of the world for navigation use in a suitable reform). For this map he uses his Mercator projection, a cylindrical projection that will make him world famous.
He starts from a cylindrical projection in which the equator and the circles of latitude are parallel horizontal lines and the meridians vertical lines.
geniale vondst
Op een aardbol merk je dat de meridianen korter bij elkaar komen naarmate ze de polen naderen. Teken je de meridianen als evenwijdigen, dan rek je ze stelselmatig horizontaal uit. Mercator concludeert dat je een wereldkaart enkel hoekgetrouw kunt maken als je tegelijk ook de verticale as uitrekt en afstanden tussen de breedtecirkels laat toenemen naarmate ze verder van de evenaar liggen. Als resultaat worden continenten dichter bij de polen relatief groter voorgesteld dan continenten op de evenaar. Dit visuele nadeel is voor hem echter minder belangrijk dan de creatie van een hoekgetrouwe kaart en het praktisch voordeel voor de zeevaart. In volgend werkblad zie je hoe je dit kan doen.
brilliant find
On a globe one can clearly see that the meridians run closer to each other when approaching the poles. When drawing the meridians as parallels you stretch them out horizontally. Mercator concludes that it's only possible to draw a world map with true angles if you stretch out the vertical axis as well, increasing the distances between the circles of latitude further from the equator. As a result the continents nearer to the poles are represented relatively larger than the continents closer to the equator. But for Mercator this visual disadvantage is less important than the creation of a map with true angles and its practical advantage for see shipping. In the next worksheet you can see how you can do this.
wiskunde toen en nu
Hoe Mercator de vergrotingen van de verticale as vond is niet duidelijk. Voor een exacte berekening heb je integralen nodig, maar die werden pas in de 17e eeuw uitgevonden. Een benadering met logaritmen kan ook, maar ook die werden slechts 20 jaar na de dood van Mercator gepubliceerd.
Vermoed wordt dat Mercator metingen deed op de globe die hij in 1541 geconstrueerd had.
Via integraalrekening kunnen we een formule uitwerken die voor een punt met gegeven lengteligging en een breedteligging een x- en een y-coördinaat berekent op een wereldkaart met mercatorprojectie.
De transformatieformule wordt:
mathematics then and now
How Mercator found the dilation factors for the vertical axis is not clear. For an exact calculation you need integrals, but these were only invented in the 17th century. An approximation with logarithms is an alternative, but those too were only published 20 jaar after the death of Mercator.
One suspects that Mercator executed some measurements on the globe he created in 1541.
With some calculus we can work out a formula that calculates for a point with given longitude and a latitude an x- and an y-coordinate on a world map with mercator projection.
The transformation formula is: