Google Classroom
谷歌课堂
GeoGebra
GeoGebra 教室
登录
搜索
Google Classroom
谷歌课堂
GeoGebra
GeoGebra 教室
概述
Grafieken van tweedegraadsfuncties
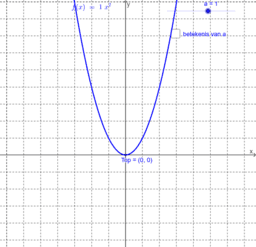
Grafiek van f(x)=ax²
Grafiek van f(x)=a(x - p)²+q
Grafieken van tweedegraadsfuncties
作者:
Sabine Van Keer
主题:
函数
,
函数图象
Invloed van de parameters op de grafiek van een tweedegraadsfunctie.
内容目录
Grafiek van f(x)=ax²
Invloed van a
De waarde van a aflezen uit de grafiek
Grafiek van f(x)=a(x - p)²+q
Grafiek van functies f(x) = a (x-p)²
Grafiek van f(x)=ax²+q
Grafiek van functies f(x)=a(x-p)²+q
下一页
Invloed van a
新资源
De volledige 13 boeken van Euclides' Elementen
oef: rekenlabyrint
Yusif ibn Kuseyir mausoleum - zijpaneel 2
een lijnstuk verdelen in uiterste en middelste reden
limieten en uitgebreide getallenverzameling
发现资源
Doorsnede kubus 20 TM
M4 WI H01 periodiek
Pennybacker Bridge
demo_raaklijn
bdag
发现主题
三角形
球面
平面图形
等腰三角形
平面